


Appendix A: Standardization, Reliability, and Validity Tables
This appendix details the statistical results pertaining to the standardization, reliability, and validity of the EQ-i® 2.0 and EQ 360® 2.0, as summarized in Standardization, Reliability, and Validity. Please see Standardization, Reliability, and Validity for full interpretive text.
- Table A.1. Demographic Characteristics of EQ-i 2.0 Pilot Data
- Table A.2. Comparison of EQ-i 2.0 Scores in U.S. and Canadian Samples
- Table A.3. Age × Gender Distribution: EQ-i 2.0 Normative Sample
- Table A.4. Race/Ethnicity Distribution: EQ-i 2.0 Normative Sample
- Table A.5. Geographic Region Distribution: EQ-i 2.0 Normative Sample
- Table A.6. Education Level Distribution: EQ-i 2.0 Normative Sample
- Table A.7. Multivariate Effects of Age and Gender: EQ-i 2.0
- Table A.8. Effect Sizes for Gender and Age Effects in the EQ-i 2.0 Normative Sample
- Table A.9. Gender Differences in EQ-i 2.0 Scores
- Table A.10. Age Differences in EQ-i 2.0 Scores
- Figure A.1. Histogram of EQ-i 2.0 Total EI Standard Scores in the Normative Sample
- Table A.11. Internal Consistency: EQ-i 2.0 Normative Sample
- Table A.12. Demographic Characteristics of the EQ-i 2.0 Test-Retest Samples
- Table A.13. EQ-i 2.0 Test-retest Correlations and Descriptive Statistics
- Table A.14. Differences between Time 1 and Time 2 EQ-i 2.0 Standard Scores: 2–4-Week Interval
- Table A.15. Differences between Time 1 and Time 2 EQ-i 2.0 Standard Scores: 8-Week Interval
- Table A.16. Demographic Distributions of EQ-i 2.0 Exploratory and Confirmatory Normative Subsamples
- Table A.17. Confirmatory Factor Analysis Results for EQ-i 2.0
- Table A.18. Correlations among EQ-i 2.0 Composite Scales
- Table A.19. Correlations among EQ-i 2.0 Subscales
- Table A.20. Demographic Characteristics of EQ-i 2.0 Validity Samples
- Table A.21. Correlations between EQ-i 2.0 and EQ-i
- Table A.22. Correlations between the EQ-i 2.0 and the Social Skills Inventory
- Table A.23. Correlations between EQ-i 2.0 and NEO Five Factor Inventory
- Table A.24. Correlations between EQ-i 2.0 and Mayer-Salovey-Caruso Emotional Intelligence Test - Expert Consensus Scores: Total, Area, and Branch Scores
- Table A.25. Correlations between EQ-i 2.0 and Mayer-Salovey-Caruso Emotional Intelligence Test - Expert Consensus Scores: Task Scores
- Table A.26. Correlations between EQ-i 2.0 and Watson-Glaser II Critical Thinking Appraisal
- Table A.27. Demographic Characteristics of Corporate Leaders Sample
- Table A.28. EQ-i 2.0 Scores in Corporate Leaders
- Table A.29. Education Level Effects on EQ-i 2.0 Scores in the Normative Sample
- Table A.30. Demographic Characteristics of EQ-i 2.0 Clinical and Matched General Population Samples
- Table A.31. EQ-i 2.0 Clinical Differences
- Table A.32. EQ-i 2.0 Scores by Racial/Ethnic Group in the Normative Sample
- Table A.33. Comparison of Simulation and Control Samples on EQ-i 2.0 Positive Impression and Negative Impression Scale Scores
- Table A.34. Frequencies and Descriptive Statistics of Inconsistency Index Scores in EQ-i 2.0 Normative and Random Samples
- Table A.35. Demographic Description of EQ 360 2.0 Pilot Data (Ratees)
- Table A.36. Comparison of EQ 360 2.0 Scores in U.S. and Canadian Samples
- Table A.37. Length of Rater/Ratee Relationship: EQ 360 2.0 Normative Sample
- Table A.38. Strength of Rater/Ratee Relationship: EQ 360 2.0 Normative Sample
- Table A.39. Distribution of Rater Types by Gender: EQ 360 2.0 Normative Sample
- Table A.40. Ratee Age Group by Gender Distribution: EQ 360 2.0 Normative Sample
- Table A.41. Distribution of Ratee Race/Ethnicity by Rater Type: EQ 360 2.0 Normative Sample
- Table A.42. Ratee Geographic Region Distribution: EQ 360 2.0 Normative Sample
- Table A.43. Multivariate Effects of Ratee Age, Gender, and Rater Type on EQ 360 2.0 Scores
- Table A.44. Effect Sizes for Gender, Age, and Rater Type Effects in the EQ 360 2.0 Normative Sample
- Table A.45. Ratee Gender Differences in EQ 360 2.0 Scores
- Table A.46. Ratee Age Differences in EQ 360 2.0 Scores
- Table A.47. Rater Type Differences in EQ 360 2.0 Scores
- Figure A.2. Histogram of EQ 360 2.0 Total EI Standard Score in the Normative Sample
- Table A.48. Internal Consistency: EQ 360 2.0 Normative Sample
- Table A.49. Demographic Characteristics of EQ 360 2.0 Test-Retest Sample
- Table A.50. EQ 360 2.0 Test-Retest Correlations and Descriptive Statistics
- Table A.51. Differences between Time 1 and Time 2 EQ 360 2.0 Standard Scores
- Table A.52. Correlations among EQ 360 2.0 Composite Scales (Normative Sample)
- Table A.53. Correlations among EQ 360 2.0 Subscales (Normative Sample)
- Table A.54. Demographic Distribution of Self-Other Agreement Sample
- Table A.55. Self-Other Agreement Correlations between the EQ-i 2.0 and EQ 360 2.0
- Table A.56. Comparison of EQ-i 2.0 and EQ 360 2.0 Standard Scores
- Table A.57. Demographic Characteristics of SAS-SR Validity Sample
- Table A.58. Multiple Regression Results for EQ-i 2.0 and EQ 360 2.0 Predicting Social Adjustment Scale–Self-Report Total Scores
- Table A.59. Interaction Effects between Rater Race/Ethnicity and Ratee Race/Ethnicity: EQ 360 2.0 Normative Sample
Table A.1. Demographic Characteristics of EQ-i 2.0 Pilot Data
The following table summarizes the demographic characteristics of the EQ-i 2.0 pilot data. Ideally, pilot data should include representation from a wide range of demographic (gender, age, race, education level) groups, as was the case in the EQ-i 2.0 pilot data.
Demographic |
N | % | |
|---|---|---|---|
Gender |
Male | 554 | 41.2 |
| Female | 792 | 58.8 | |
Age Group (Years) |
18–24 | 586 | 43.5 |
| 25–29 | 285 | 21.2 | |
| 30–34 | 208 | 15.5 | |
| 35–39 | 163 | 12.1 | |
| 40–44 | 104 | 7.7 | |
Race/Ethnicity |
Black | 107 | 7.9 |
| Hispanic/Latino | 124 | 9.2 | |
| White | 1,008 | 74.9 | |
| Other | 107 | 7.9 | |
Education Level |
High School or Less | 280 | 20.8 |
| Some College/University | 447 | 33.2 | |
| College/University or Higher | 615 | 45.7 | |
| Missing | 4 | 0.3 | |
Total |
1,346 | 100.0 | |
Table A.2. Comparison of EQ-i 2.0 Scores in U.S. and Canadian Samples
The following table provides mean and standard deviations of EQ-i 2.0 scores in U.S. and Canadian samples. d values provide an effect size to describe differences between the two countries as small, medium, or large. F and p values provide statistical significance tests for these differences. A lack of meaningful (i.e., |d| ≥ .20) differences between U.S. and Canadian participants supports combining the two countries in the normative sample, as was the case in the EQ-i 2.0 data.
Scale |
U.S. | Canada | d | F | p | |
|---|---|---|---|---|---|---|
Total EI |
M | 98.9 | 99.5 | -0.04 | 0.74 | .391 |
| SD | 15.4 | 15.5 | ||||
Self-Perception Composite |
M | 99.8 | 100.1 | -0.02 | 0.21 | .646 |
| SD | 15.3 | 15.4 | ||||
Self-Regard |
M | 99.1 | 100.0 | -0.06 | 1.57 | .210 |
| SD | 14.9 | 15.0 | ||||
Self-Actualization |
M | 100.5 | 100.7 | -0.01 | 0.07 | .789 |
| SD | 15.3 | 15.4 | ||||
Emotional Self-Awareness |
M | 99.9 | 99.6 | 0.02 | 0.27 | .606 |
| SD | 15.3 | 15.4 | ||||
Self-Expression Composite |
M | 98.4 | 99.1 | -0.04 | 0.85 | .358 |
| SD | 15.3 | 15.4 | ||||
Emotional Expression |
M | 99.2 | 99.2 | 0.00 | 0.00 | .991 |
| SD | 15.2 | 15.3 | ||||
Assertiveness |
M | 100.1 | 100.4 | -0.02 | 0.16 | .689 |
| SD | 14.9 | 15.0 | ||||
Independence |
M | 97.2 | 98.4 | -0.08 | 3.22 | .073 |
| SD | 15.2 | 15.3 | ||||
Interpersonal Composite |
M | 99.6 | 100.7 | -0.07 | 2.10 | .147 |
| SD | 15.3 | 15.4 | ||||
Interpersonal Relationships |
M | 99.3 | 100.4 | -0.08 | 2.68 | .102 |
| SD | 15.3 | 15.4 | ||||
Empathy |
M | 99.8 | 100.1 | -0.02 | 0.28 | .596 |
| SD | 15.2 | 15.3 | ||||
Social Responsibility |
M | 100.1 | 101.3 | -0.08 | 3.01 | .083 |
| SD | 15.1 | 15.2 | ||||
Decision Making Composite |
M | 98.5 | 97.3 | 0.07 | 2.56 | .109 |
| SD | 15.5 | 15.6 | ||||
Problem Solving |
M | 97.8 | 97.5 | 0.02 | 0.14 | .710 |
| SD | 15.3 | 15.4 | ||||
Reality Testing |
M | 99.9 | 99.6 | 0.02 | 0.11 | .739 |
| SD | 15.3 | 15.3 | ||||
Impulse Control |
M | 99.0 | 96.7 | 0.14 | 9.64 | .002 |
| SD | 15.5 | 15.6 | ||||
Stress Management Composite |
M | 98.7 | 100.2 | -0.10 | 4.84 | .028 |
| SD | 15.1 | 15.1 | ||||
Flexibility |
M | 98.1 | 99.7 | -0.10 | 4.89 | .027 |
| SD | 15.1 | 15.2 | ||||
Stress Tolerance |
M | 99.0 | 100.2 | -0.08 | 2.76 | .097 |
| SD | 14.8 | 14.9 | ||||
Optimism |
M | 99.5 | 100.6 | -0.08 | 2.63 | .105 |
| SD | 15.2 | 15.3 | ||||
Happiness |
M | 99.6 | 100.8 | -0.08 | 2.69 | .101 |
| SD | 15.2 | 15.3 | ||||
Note. Sample size ranges (due to missing data): U.S., N = 5,902 to 5,905; Canada, N = 507 to 508. df for F-tests: Total EI = 1, 6407; composite scales = 1, 6406; subscales = 1, 6403. Positive Cohen's d values signify higher means in the U.S. group, negative Cohen's d values signify higher means in the Canadian group. Guidelines for evaluating |d| are .20 = small, .50 = medium, .80 = large.
Table A.3. Age × Gender Distribution: EQ-i 2.0 Normative Sample
The following table conveys the distribution of EQ-i 2.0 normative sample participants, categorized by age group and gender. An ideal distribution is one that is similarly proportioned across all groups, as was the case in the EQ-i 2.0 normative sample, demonstrating equal representation of all age × gender groups.
Age Group (Years) |
Male | Female | Total | |||
|---|---|---|---|---|---|---|
| N | % | N | % | N | % | |
| 18–24 | 200 | 5.0 | 200 | 5.0 | 400 | 10.0 |
| 25–29 | 200 | 5.0 | 200 | 5.0 | 400 | 10.0 |
| 30–34 | 200 | 5.0 | 200 | 5.0 | 400 | 10.0 |
| 35–39 | 200 | 5.0 | 200 | 5.0 | 400 | 10.0 |
| 40–44 | 200 | 5.0 | 200 | 5.0 | 400 | 10.0 |
| 45–49 | 200 | 5.0 | 200 | 5.0 | 400 | 10.0 |
| 50–54 | 200 | 5.0 | 200 | 5.0 | 400 | 10.0 |
| 55–59 | 200 | 5.0 | 200 | 5.0 | 400 | 10.0 |
| 60–64 | 200 | 5.0 | 200 | 5.0 | 400 | 10.0 |
| 65+ | 200 | 5.0 | 200 | 5.0 | 400 | 10.0 |
| Total | 2,000 | 50.0 | 2,000 | 50.0 | 4,000 | 100.0 |
Table A.4. Race/Ethnicity Distribution: EQ-i 2.0 Normative Sample
The following table summarizes the race/ethnicity distribution of the EQ-i 2.0 normative sample along with Census information. Ideally, the normative sample should show race/ethnicity proportions similar to the Census, suggesting the normative sample is representative of the general population. The EQ-i 2.0 normative sample showed percentages within 4% for each racial/ethnic group, suggesting it is very similar to the Census.
Country |
Race/Ethnicity |
N | % | Census % |
|---|---|---|---|---|
U.S. |
Black | 410 | 11.4 | 12.3 |
| Hispanic/Latino | 432 | 12.0 | 15.1 | |
| White | 2,519 | 70.0 | 66.0 | |
| Other | 239 | 6.6 | 6.6 | |
| Total | 3,600 | 100.0 | 100.0 | |
Canada |
White | 315 | 78.8 | 80.0 |
| Non-White | 85 | 21.3 | 20.0 | |
| Total | 400 | 100.0 | 100.0 |
Table A.5. Geographic Region Distribution: EQ-i 2.0 Normative Sample
The following table summarizes the geographic region distribution of the EQ-i 2.0 normative sample along with Census information. Ideally, the normative sample should show region proportions similar to the Census. The EQ-i 2.0 normative sample showed percentages within 2% for each region, suggesting it is very similar to the Census.
Country |
Region |
N | % | Census % |
|---|---|---|---|---|
U.S. |
Northeast | 655 | 18.2 | 18.1 |
| Midwest | 793 | 22.0 | 21.9 | |
| South | 1,292 | 35.9 | 36.7 | |
| West | 860 | 23.9 | 23.3 | |
| Total | 3,600 | 100.0 | 100.0 | |
Canada |
West | 54 | 13.5 | 13.0 |
| Prairies | 72 | 18.0 | 17.1 | |
| Central | 244 | 61.0 | 62.4 | |
| East | 30 | 7.5 | 7.3 | |
| Total | 400 | 100.0 | 100.0 |
Table A.6. Education Level Distribution: EQ-i 2.0 Normative Sample
The following table summarizes the education level (i.e., highest level of attained education) distribution of the EQ-i 2.0 normative sample along with Census information. Ideally, the normative sample should show education level proportions similar to the Census, as found in the EQ-i 2.0 normative sample (i.e., the sample was within 2% of Census), suggesting the sample is representative of the general population.
Country |
Education Level |
N | % | Census % |
|---|---|---|---|---|
U.S. and Canada |
High school diploma or less | 1,751 | 43.8 | 46.6 |
| Some college/university | 1,119 | 28.0 | 27.2 | |
| College/university graduate or higher | 1,130 | 28.2 | 26.2 | |
| Total | 4,000 | 100.0 | 100.0 |
Table A.7. Multivariate Effects of Age and Gender: EQ-i 2.0
The following table summarizes the results from the multivariate analyses of covariance (MANCOVAs) conducted on the composite scales and subscales to examine potential effects of gender, age, or the interaction between gender and age on EQ-i 2.0 scores in the normative sample. Wilks’ lambda ranges from 0.00 to 1.00 and depicts the amount of variance not explained by the demographic variable. F and p values convey the statistical significance of the demographic variables. Partial η2 values provide an effect size for describing the effects as small, medium, or large. Meaningful effect sizes (i.e., partial η2 ≥ .01) suggest differences among participants based on the demographic variable.
Analysis |
Demographic Variable |
Wilks’ Lambda | F (df) | p | Partial η2 |
|---|---|---|---|---|---|
Composite Scales |
Gender | .935 | 55.56 (5, 3984) | < .001 | .07 |
| Age | .955 | 9.22 (20, 13214.383) | < .001 | .01 | |
| Gender × Age | .989 | 2.16 (20, 13214.38) | .002 | .00 | |
Subscales |
Gender | .842 | 46.56 (15, 3970) | < .001 | .16 |
| Age | .854 | 10.03 (64, 15544.13) | < .001 | .04 | |
| Gender × Age | .973 | 1.67 (64, 15544.13) | .001 | .01 |
Table A.8. Effect Sizes for Gender and Age Effects in the EQ-i 2.0 Normative Sample
The following table summarizes the effect sizes for the effects of gender, age, and the gender × age interaction on the EQ-i 2.0 Total EI score, composite scales, and subscales in the normative sample. Meaningful effect sizes (i.e., |d| ≥ .20, partial η2 ≥ .01), which were found for several EQ-i 2.0 composite scales and subscales, suggest differences among participants based on the demographic variable, and that separate demographic norm groups may be required.
Scale |
Gender (Cohen’s d) |
Age (partial η2) |
Gender × Age Interaction (partial η2) |
|---|---|---|---|
Total EI |
-0.03 | .02 | .00 |
Self-Perception Composite |
0.02 | .01 | .00 |
Self-Regard |
0.17 | .03 | .00 |
Self-Actualization |
0.01 | .01 | .00 |
Emotional Self-Awareness |
-0.22 | .00 | .00 |
Self-Expression Composite |
0.01 | .02 | .00 |
Emotional Expression |
-0.31 | .01 | .00 |
Assertiveness |
0.19 | .00 | .00 |
Independence |
0.21 | .05 | .00 |
Interpersonal Composite |
-0.33 | .01 | .00 |
Interpersonal Relationships |
-0.18 | .01 | .00 |
Empathy |
-0.49 | .01 | .00 |
Social Responsibility |
-0.13 | .02 | .00 |
Decision Making Composite |
0.11 | .02 | .00 |
Problem Solving |
0.26 | .04 | .00 |
Reality Testing |
0.03 | .01 | .00 |
Impulse Control |
-0.03 | .01 | .00 |
Stress Management Composite |
0.08 | .02 | .00 |
Flexibility |
-0.04 | .01 | .00 |
Stress Tolerance |
0.30 | .01 | .00 |
Optimism |
-0.06 | .02 | .00 |
Happiness |
-0.04 | .02 | .00 |
Note. N = 4,000. Positive Cohen’s d values represent higher scores in males, negative Cohen’s d values represent higher scores in females. Guidelines for evaluating |d| are .20 = small, .50 = medium, .80 = large. Guidelines for evaluating partial η2 are .01 = small, .06 = medium, .14 = large.
Table A.9. Gender Differences in EQ-i 2.0 Scores
The following table provides EQ-i 2.0 means and standard deviations for males and females in the normative sample. F and p values convey the statistical significance of gender differences. p values less than .01, which were found for many EQ-i 2.0 composite scales and subscales, suggest significant differences between males and females.
Scale |
Male (N = 2,000) |
Female (N = 1,996) |
F (1, 3985) |
p | |
|---|---|---|---|---|---|
Total EI |
M | 99.8 | 100.2 | 0.78 | .378 |
| SD | 15.2 | 15.2 | |||
Self-Perception Composite |
M | 100.1 | 99.9 | 0.28 | .598 |
| SD | 15.2 | 15.2 | |||
Self-Regard |
M | 101.3 | 98.7 | 27.11 | < .001 |
| SD | 15.1 | 15.1 | |||
Self-Actualization |
M | 100.1 | 99.9 | 0.14 | .711 |
| SD | 15.2 | 15.2 | |||
Emotional Self-Awareness |
M | 98.4 | 101.7 | 44.28 | < .001 |
| SD | 15.3 | 15.3 | |||
Self-Expression Composite |
M | 100.0 | 100.0 | 0.02 | .884 |
| SD | 15.3 | 15.3 | |||
Emotional Expression |
M | 97.6 | 102.4 | 93.63 | < .001 |
| SD | 15.2 | 15.2 | |||
Assertiveness |
M | 101.4 | 98.6 | 32.76 | < .001 |
| SD | 15.3 | 15.3 | |||
Independence |
M | 101.6 | 98.5 | 41.62 | < .001 |
| SD | 14.9 | 14.9 | |||
Interpersonal Composite |
M | 97.5 | 102.5 | 101.97 | < .001 |
| SD | 15.1 | 15.1 | |||
Interpersonal Relationships |
M | 98.6 | 101.4 | 31.83 | < .001 |
| SD | 15.3 | 15.3 | |||
Empathy |
M | 96.3 | 103.7 | 232.15 | < .001 |
| SD | 14.9 | 14.9 | |||
Social Responsibility |
M | 99.0 | 101.0 | 16.18 | < .001 |
| SD | 15.1 | 15.1 | |||
Decision Making Composite |
M | 100.9 | 99.1 | 12.41 | < .001 |
| SD | 15.1 | 15.1 | |||
Problem Solving |
M | 102.0 | 98.1 | 63.84 | < .001 |
| SD | 14.9 | 14.9 | |||
Reality Testing |
M | 100.2 | 99.8 | 0.62 | .431 |
| SD | 15.3 | 15.3 | |||
Impulse Control |
M | 99.8 | 100.2 | 0.85 | .358 |
| SD | 15.3 | 15.3 | |||
Stress Management Composite |
M | 100.6 | 99.4 | 6.15 | .013 |
| SD | 15.2 | 15.2 | |||
Flexibility |
M | 99.7 | 100.3 | 1.74 | .188 |
| SD | 15.3 | 15.3 | |||
Stress Tolerance |
M | 102.2 | 97.8 | 83.72 | < .001 |
| SD | 15.0 | 15.0 | |||
Optimism |
M | 99.5 | 100.5 | 3.68 | .055 |
| SD | 15.2 | 15.2 | |||
Happiness |
M | 99.7 | 100.3 | 1.66 | .197 |
| SD | 15.2 | 15.2 | |||
Table A.10. Age Differences in EQ-i 2.0 Scores
The following table provides means and standard deviations for the EQ-i 2.0 Total EI score, composite scales, and subscales for the various age groups in the EQ-i 2.0 normative sample. F and p values convey the statistical significance of age differences. p values less than .01, which were found for many EQ-i 2.0 composite scales and subscales, suggest an overall difference among the age groups.
Scale |
18–29 (N = 799) |
30–39 (N = 799) |
40–49 (N = 800) |
50–59 (N = 800) |
60+ (N = 799) |
F (1, 3985) |
p | |
|---|---|---|---|---|---|---|---|---|
Total EI |
M | 97.0 | 98.6 | 100.6 | 101.3 | 102.5 | 17.18 | < .001 |
| SD | 14.9 | 14.9 | 14.9 | 14.9 | 14.9 | |||
Self-Perception Composite |
M | 98.6 | 98.4 | 99.8 | 100.6 | 102.6 | 10.47 | < .001 |
| SD | 14.9 | 14.9 | 14.9 | 14.9 | 14.9 | |||
Self-Regard |
M | 97.1 | 98.1 | 99.8 | 101.1 | 104.0 | 26.50 | < .001 |
| SD | 14.7 | 14.7 | 14.7 | 14.7 | 14.7 | |||
Self-Actualization |
M | 99.6 | 98.6 | 99.8 | 100.4 | 101.7 | 4.72 | .001 |
| SD | 14.8 | 14.8 | 14.8 | 14.8 | 14.8 | |||
Emotional Self- Awareness |
M | 100.2 | 99.7 | 100.0 | 99.8 | 100.4 | 0.33 | .861 |
| SD | 15.0 | 15.0 | 14.9 | 14.9 | 14.9 | |||
Self-Expression Composite |
M | 96.5 | 99.7 | 101.4 | 101.2 | 101.2 | 15.41 | < .001 |
| SD | 14.9 | 14.9 | 14.9 | 14.9 | 14.9 | |||
Emotional Expression |
M | 97.9 | 100.3 | 100.8 | 100.5 | 100.5 | 4.86 | .001 |
| SD | 14.9 | 14.9 | 14.8 | 14.8 | 14.9 | |||
Assertiveness |
M | 100.4 | 99.7 | 99.8 | 99.5 | 100.8 | 1.05 | .380 |
| SD | 15.0 | 15.0 | 14.9 | 14.9 | 15.0 | |||
Independence |
M | 93.9 | 99.4 | 102.5 | 102.6 | 101.7 | 49.70 | < .001 |
| SD | 14.6 | 14.6 | 14.5 | 14.6 | 14.6 | |||
Interpersonal Composite |
M | 98.3 | 98.5 | 99.7 | 100.9 | 102.6 | 11.30 | < .001 |
| SD | 14.8 | 14.8 | 14.8 | 14.8 | 14.8 | |||
Interpersonal Relationships |
M | 98.4 | 98.9 | 100.4 | 100.9 | 101.6 | 6.43 | < .001 |
| SD | 14.9 | 15.0 | 14.9 | 14.9 | 14.9 | |||
Empathy |
M | 99.1 | 99.1 | 99.2 | 100.3 | 102.2 | 6.92 | < .001 |
| SD | 14.6 | 14.6 | 14.6 | 14.6 | 14.6 | |||
Social Responsibility |
M | 98.2 | 98.0 | 99.7 | 101.1 | 103.1 | 16.23 | < .001 |
| SD | 14.8 | 14.8 | 14.8 | 14.8 | 14.8 | |||
Decision Making Composite |
M | 96.2 | 99.0 | 101.0 | 101.9 | 102.0 | 21.44 | < .001 |
| SD | 14.8 | 14.8 | 14.8 | 14.8 | 14.8 | |||
Problem Solving |
M | 95.2 | 98.6 | 101.8 | 102.2 | 102.4 | 36.17 | < .001 |
| SD | 14.6 | 14.6 | 14.6 | 14.6 | 14.6 | |||
Reality Testing |
M | 98.7 | 98.6 | 99.9 | 100.5 | 102.4 | 8.42 | < .001 |
| SD | 14.9 | 14.9 | 14.9 | 14.9 | 14.9 | |||
Impulse Control |
M | 97.5 | 100.4 | 100.6 | 101.5 | 100.0 | 8.34 | < .001 |
| SD | 15.0 | 15.0 | 14.9 | 14.9 | 15.0 | |||
Stress Management Composite |
M | 97.2 | 98.6 | 100.9 | 101.1 | 102.3 | 15.38 | < .001 |
| SD | 14.9 | 14.9 | 14.8 | 14.8 | 14.8 | |||
Flexibility |
M | 96.9 | 99.7 | 101.2 | 101.3 | 100.9 | 11.91 | < .001 |
| SD | 15.0 | 15.0 | 14.9 | 14.9 | 15.0 | |||
Stress Tolerance |
M | 97.6 | 99.0 | 101.4 | 100.5 | 101.6 | 10.42 | < .001 |
| SD | 14.6 | 14.6 | 14.6 | 14.6 | 14.6 | |||
Optimism |
M | 98.3 | 98.0 | 99.6 | 101.0 | 103.2 | 16.43 | < .001 |
| SD | 14.9 | 14.9 | 14.9 | 14.9 | 14.9 | |||
Happiness |
M | 98.1 | 98.0 | 98.9 | 100.9 | 104.1 | 23.61 | < .001 |
| SD | 14.9 | 14.9 | 14.8 | 14.9 | 14.9 | |||
Figure A.1. Histogram of EQ-i 2.0 Total EI Standard Scores in the Normative Sample
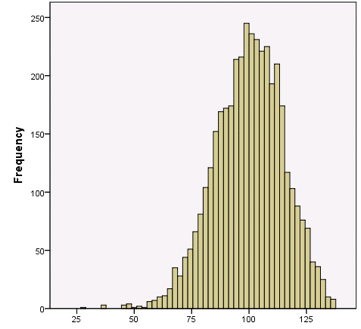
The following figure illustrates the distribution of EQ-i 2.0 Total EI scores in the normative sample. Distributions that approximate a normal (“bell-shaped”) curve, such as those found in the figure below, suggest it is unnecessary to apply a normalizing transformation to EQ-i 2.0 scores.
Table A.11. Internal Consistency: EQ-i 2.0 Normative Sample
The following table summarizes the internal consistency (Cronbach’s alpha) values for the EQ-i 2.0 Total EI score, composite scales, and subscales in the EQ-i 2.0 normative groups. Alpha values range from 0.00 to 1.00. Higher values, like those found in the EQ-i 2.0 normative sample, provide evidence for strong reliability..
Scale |
# of items | EQ-i 2.0 Normative Group | ||||||||||
|---|---|---|---|---|---|---|---|---|---|---|---|---|
| General (Total Sample) | Male | Female | ||||||||||
| 18–29 | 30–39 | 40–49 | 50–59 | 60+ | 18–29 | 30–39 | 40–49 | 50–59 | 60+ | |||
Total EI |
118 | .97 | .97 | .97 | .97 | .97 | .97 | .97 | .97 | .98 | .97 | .98 |
Self-Perception Composite |
24 | .93 | .93 | .93 | .93 | .92 | .92 | .94 | .93 | .94 | .94 | .93 |
Self-Regard |
8 | .91 | .92 | .91 | .90 | .89 | .86 | .92 | .91 | .92 | .92 | .90 |
Self-Actualization |
9 | .88 | .88 | .88 | .88 | .88 | .87 | .90 | .89 | .90 | .88 | .87 |
Emotional Self-Awareness |
7 | .81 | .79 | .81 | .81 | .80 | .81 | .80 | .80 | .81 | .81 | .80 |
Self-Expression Composite |
23 | .88 | .88 | .88 | .88 | .87 | .86 | .88 | .88 | .88 | .88 | .89 |
Emotional Expression |
8 | .84 | .83 | .85 | .84 | .84 | .82 | .83 | .85 | .82 | .84 | .82 |
Assertiveness |
7 | .77 | .76 | .75 | .75 | .77 | .77 | .78 | .77 | .79 | .78 | .79 |
Independence |
8 | .81 | .82 | .79 | .80 | .75 | .75 | .81 | .82 | .80 | .81 | .82 |
Interpersonal Composite |
23 | .92 | .92 | .92 | .92 | .92 | .93 | .92 | .91 | .93 | .92 | .93 |
Interpersonal Relationships |
7 | .86 | .87 | .89 | .87 | .86 | .87 | .86 | .86 | .88 | .86 | .87 |
Empathy |
9 | .88 | .86 | .88 | .87 | .88 | .88 | .87 | .85 | .88 | .86 | .86 |
Social Responsibility |
6 | .80 | .77 | .81 | .78 | .81 | .82 | .80 | .80 | .81 | .80 | .82 |
Decision Making Composite |
24 | .88 | .87 | .88 | .89 | .88 | .88 | .89 | .86 | .87 | .87 | .88 |
Problem Solving |
8 | .85 | .83 | .85 | .86 | .85 | .85 | .85 | .84 | .84 | .82 | .85 |
Reality Testing |
9 | .81 | .80 | .80 | .79 | .80 | .84 | .79 | .80 | .83 | .81 | .81 |
Impulse Control |
8 | .77 | .79 | .75 | .79 | .74 | .75 | .81 | .75 | .77 | .76 | .77 |
Stress Management Composite |
24 | .92 | .90 | .92 | .91 | .91 | .92 | .92 | .91 | .92 | .92 | .92 |
Flexibility |
8 | .80 | .78 | .80 | .77 | .78 | .80 | .82 | .83 | .79 | .80 | .82 |
Stress Tolerance |
8 | .87 | .86 | .84 | .85 | .86 | .89 | .86 | .85 | .86 | .87 | .87 |
Optimism |
8 | .89 | .88 | .90 | .88 | .89 | .88 | .89 | .89 | .90 | .89 | .89 |
Happiness |
8 | .92 | .91 | .91 | .91 | .92 | .90 | .90 | .91 | .92 | .93 | .92 |
N |
4,000 | 400 | 400 | 400 | 400 | 400 | 400 | 400 | 400 | 400 |
400 |
|
Table A.12. Demographic Characteristics of the EQ-i 2.0 Test-Retest Samples
The following table summarizes the demographic characteristics of the EQ-i 2.0 test-retest samples. Ideally, these samples should include representation from a wide range of demographic groups, as found in the EQ-i 2.0 test-retest samples.
Demographic |
2–4 Weeks | 8 Weeks | |||
|---|---|---|---|---|---|
| N | % | N | % | ||
Gender |
Male | 101 | 49.5 | 52 | 49.1 |
| Female | 103 | 50.5 | 54 | 50.9 | |
Race/Ethnicity |
Black | 29 | 14.2 | 3 | 2.8 |
| Hispanic/Latino | 13 | 6.4 | 2 | 1.9 | |
| White | 141 | 69.1 | 95 | 89.6 | |
| Other | 21 | 10.3 | 6 | 5.7 | |
Age Group (Years) |
18–29 | 23 | 11.3 | 11 | 10.4 |
| 30–39 | 47 | 23.0 | 9 | 8.5 | |
| 40–49 | 38 | 18.6 | 19 | 17.9 | |
| 50–59 | 41 | 20.1 | 35 | 33.0 | |
| 60+ | 55 | 27.0 | 32 | 30.2 | |
| M (SD) | 47.7 (15.2) | 51.4 (13.9) | |||
Total |
204 | 100.0 | 106 | 100.0 | |
Table A.13. EQ-i 2.0 Test-retest Correlations and Descriptive Statistics
The following table summarizes the test-retest correlations and time 1 and time 2 means and standard deviations for the EQ-i 2.0 Total EI score, composite scales, and subscales in the 2–4 week and 8-week retest samples. Correlations range from 0.00 to 1.00. Higher values, as found in the EQ-i 2.0 test-retest samples, suggest excellent test-retest reliability.
Scale |
2–4 Weeks | 8 Weeks | ||||||||
|---|---|---|---|---|---|---|---|---|---|---|
| Test-retest r | Time 1 | Time 2 | Test-retest r | Time 1 | Time 2 | |||||
| M | SD | M | SD | M | SD | M | SD | |||
Total EI |
.92 | 98.3 | 16.6 | 98.8 | 17.4 | .81 | 97.1 | 14.8 | 98.1 | 14.8 |
Self-Perception Composite |
.90 | 98.6 | 15.8 | 98.7 | 17.2 | .80 | 96.4 | 16.0 | 97.3 | 15.6 |
Self-Regard |
.88 | 98.7 | 15.9 | 99.4 | 16.9 | .84 | 98.1 | 15.3 | 98.3 | 15.8 |
Self-Actualization |
.88 | 98.6 | 15.8 | 98.5 | 16.8 | .74 | 94.4 | 15.6 | 95.8 | 14.8 |
Emotional Self-Awareness |
.82 | 99.3 | 15.4 | 98.7 | 16.8 | .72 | 98.7 | 15.3 | 99.5 | 15.0 |
Self-Expression Composite |
.86 | 99.3 | 15.7 | 99.5 | 15.9 | .80 | 98.9 | 14.7 | 98.7 | 14.4 |
Emotional Expression |
.81 | 98.1 | 15.9 | 98.9 | 16.2 | .74 | 100.7 | 15.0 | 100.5 | 13.6 |
Assertiveness |
.80 | 99.9 | 14.8 | 100.1 | 14.7 | .75 | 97.3 | 14.9 | 97.5 | 14.0 |
Independence |
.85 | 100.6 | 15.5 | 100.0 | 16.0 | .81 | 99.0 | 14.0 | 98.4 | 15.1 |
Interpersonal Composite |
.91 | 98.1 | 16.4 | 98.1 | 16.1 | .76 | 97.2 | 15.6 | 98.3 | 14.7 |
Interpersonal Relationships |
.88 | 98.9 | 16.1 | 98.9 | 15.5 | .77 | 97.7 | 16.5 | 98.7 | 15.4 |
Empathy |
.89 | 98.4 | 16.3 | 98.4 | 16.2 | .72 | 99.3 | 15.6 | 99.9 | 14.8 |
Social Responsibility |
.86 | 97.7 | 16.3 | 97.8 | 15.9 | .77 | 95.2 | 15.1 | 96.6 | 14.5 |
Decision Making Composite |
.88 | 98.7 | 15.7 | 99.7 | 17.1 | .83 | 98.2 | 14.5 | 99.7 | 14.7 |
Problem Solving |
.82 | 98.9 | 15.9 | 100.4 | 16.5 | .73 | 98.6 | 14.9 | 100.5 | 14.0 |
Reality Testing |
.84 | 98.7 | 15.9 | 98.6 | 16.3 | .75 | 97.6 | 15.2 | 99.3 | 15.7 |
Impulse Control |
.78 | 99.2 | 15.2 | 100.1 | 16.4 | .81 | 99.4 | 15.4 | 99.3 | 14.9 |
Stress Management Composite |
.90 | 98.0 | 17.2 | 98.8 | 17.2 | .78 | 97.2 | 14.2 | 98.2 | 14.3 |
Flexibility |
.85 | 97.8 | 15.4 | 99.1 | 16.6 | .70 | 99.5 | 14.7 | 99.8 | 14.6 |
Stress Tolerance |
.85 | 98.9 | 16.0 | 99.0 | 15.7 | .75 | 96.7 | 13.7 | 97.4 | 13.5 |
Optimism |
.88 | 98.2 | 17.2 | 98.9 | 17.0 | .80 | 97.0 | 15.2 | 98.5 | 15.7 |
Happiness |
.88 | 99.3 | 15.9 | 99.3 | 16.8 | .84 | 97.6 | 17.6 | 98.3 | 16.9 |
Note. 2- to 4-week test-retest N = 204, time interval mean = 18.4 days (SD = 3.2 days), range = 14–28 days. 8-week test-retest N = 104, time interval mean = 56.8 days (SD = 1.3 days), range = 54–59 days.
Table A.14. Differences between Time 1 and Time 2 EQ-i 2.0 Standard Scores: 2–4-Week Interval
The following table summarizes the differences between time 1 and time 2 scores for the EQ-i 2.0 Total EI score, composite scales, and subscales for the 2–4-week test-retest sample. The first set of results (% of Respondents) lists the percentage of respondents whose scores decreased by more than 15 points, changed by 15 points or less, or increased by more than 15 points over time. Test-retest stability is supported if the majority of respondents show changes of 15 points or less over time, as found in the EQ-i 2.0 2-4 week test-retest sample. The mean and standard deviation of these differences across participants is also provided, along with the 95% confidence interval (CI), which illustrates whether the difference is statistically meaningful for the sample as a whole. That is, if the CI includes zero between the lower bound (LB) and upper bound (UB), the difference is not statistically meaningful, as found for most EQ-i 2.0 scales and subscales.
Scale |
% of Respondents | M Diff |
SD | 95% CI | |||
|---|---|---|---|---|---|---|---|
| Scores Decreased More Than 1 SD (15 points) |
Scores Changed by 1 SD or Less (15 points) |
Scores Increased More Than 1 SD (15 points) |
LB | UB | |||
Total EI |
1.5 | 97.0 | 1.5 | 0.5 | 6.9 | 0.1 | 0.9 |
Self-Perception Composite |
1.5 | 96.5 | 2.0 | 0.1 | 7.4 | -0.6 | 0.8 |
Self-Regard |
1.5 | 94.5 | 4.0 | 0.7 | 8.0 | -0.1 | 1.5 |
Self-Actualization |
4.0 | 93.0 | 3.0 | -0.7 | 8.8 | -1.5 | 0.2 |
Emotional Self-Awareness |
8.5 | 91.0 | 3.5 | -0.6 | 9.8 | -1.6 | 0.3 |
Self-Expression Composite |
2.0 | 95.0 | 3.0 | 0.2 | 8.4 | -0.6 | 1.0 |
Emotional Expression |
4.0 | 90.0 | 6.0 | 0.9 | 10.0 | -0.1 | 1.9 |
Assertiveness |
4.0 | 91.5 | 4.5 | 0.0 | 8.1 | -0.8 | 0.8 |
Independence |
4.5 | 93.5 | 2.0 | 0.2 | 9.3 | -0.7 | 1.1 |
Interpersonal Composite |
2.5 | 95.5 | 2.0 | 0.0 | 7.1 | -0.7 | 0.7 |
Interpersonal Relationships |
2.5 | 94.0 | 3.5 | 0.0 | 7.8 | -0.8 | 0.7 |
Empathy |
3.5 | 93.5 | 3.0 | 0.0 | 7.6 | -0.8 | 0.7 |
Social Responsibility |
3.0 | 94.5 | 2.5 | 0.2 | 8.5 | -0.7 | 1.0 |
Decision Making Composite |
2.5 | 92.5 | 5.0 | 1.0 | 8.2 | 0.2 | 1.8 |
Problem Solving |
2.5 | 92.0 | 5.5 | 1.6 | 9.6 | 0.6 | 2.5 |
Reality Testing |
4.5 | 92.5 | 3.0 | -0.1 | 9.1 | -1.0 | 0.8 |
Impulse Control |
9.5 | 83.0 | 7.5 | 0.8 | 10.4 | -0.2 | 1.9 |
Stress Management Composite |
2.5 | 94.0 | 3.5 | 0.8 | 7.8 | 0.1 | 1.6 |
Flexibility |
2.0 | 94.5 | 3.5 | 1.3 | 8.8 | 0.5 | 2.2 |
Stress Tolerance |
4.5 | 91.5 | 4.0 | 0.1 | 8.8 | -0.8 | 1.0 |
Optimism |
4.0 | 91.5 | 4.5 | 0.7 | 8.3 | -0.1 | 1.5 |
Happiness |
3.0 | 95.0 | 2.0 | -0.1 | 8.1 | -0.9 | 0.7 |
Note. N = 204. M Diff = mean difference; CI = confidence interval; LB = lower bound, UB = upper bound.
Table A.15. Differences between Time 1 and Time 2 EQ-i 2.0 Standard Scores: 8-Week Interval
The following table summarizes the differences between time 1 and time 2 scores for the EQ-i 2.0 Total EI score, composite scales, and subscales for the 8-week test-retest sample. The first set of results (% of Respondents) lists the percentage of respondents whose scores decreased by more than 15 points, changed by 15 points or less, or increased by more than 15 points over time. Test-retest stability is supported if the majority of respondents show changes of 15 points or less over time, as found in the EQ-i 2.0 8-week test-retest sample. The mean and standard deviation of these differences across participants is also provided, along with the 95% confidence interval (CI), which illustrates whether the difference is statistically meaningful for the sample as a whole. That is, if the CI includes zero between the lower bound (LB) and upper bound (UB), the difference is not statistically meaningful, as found for most EQ-i 2.0 scales and subscales.
Scale |
% of Respondents | M Diff |
SD | 95% CI | |||
|---|---|---|---|---|---|---|---|
| Scores Decreased More than 1 SD (15 Points) |
Scores Changed by 1 SD or Less (15 Points) |
Scores Increased More than 1 SD (15 Points) |
LB | UB | |||
Total EI |
2.9 | 93.2 | 3.8 | 1.0 | 9.1 | 0.6 | 1.4 |
Self-Perception Composite |
4.8 | 91.4 | 3.8 | 1.0 | 10.0 | -0.0 | 2.0 |
Self-Regard |
5.8 | 91.4 | 2.9 | 0.3 | 8.9 | -0.5 | 1.2 |
Self-Actualization |
4.8 | 88.5 | 6.7 | -0.5 | 9.0 | -1.4 | 0.4 |
Emotional Self-Awareness |
6.7 | 84.6 | 8.7 | 1.0 | 11.5 | -0.2 | 2.1 |
Self-Expression Composite |
3.8 | 91.3 | 4.8 | -0.3 | 9.2 | -1.2 | 0.7 |
Emotional Expression |
6.7 | 86.5 | 6.7 | -0.2 | 10.5 | -1.2 | 0.9 |
Assertiveness |
3.8 | 89.4 | 6.7 | 1.3 | 11.0 | 0.2 | 2.3 |
Independence |
4.8 | 92.3 | 2.9 | 0.1 | 10.4 | -0.9 | 1.1 |
Interpersonal Composite |
3.8 | 90.4 | 5.8 | 1.1 | 10.5 | 0.0 | 2.1 |
Interpersonal Relationships |
3.8 | 90.4 | 5.8 | 1.0 | 10.8 | -0.1 | 2.1 |
Empathy |
3.8 | 91.3 | 4.8 | 0.5 | 11.4 | -0.6 | 1.6 |
Social Responsibility |
3.8 | 89.4 | 6.7 | 1.3 | 10.0 | 0.3 | 2.3 |
Decision Making Composite |
1.9 | 91.3 | 6.7 | 1.3 | 8.6 | 0.4 | 2.1 |
Problem Solving |
5.8 | 84.6 | 9.6 | 1.9 | 10.8 | 0.9 | 3.0 |
Reality Testing |
4.8 | 84.6 | 10.6 | 1.6 | 11.0 | 0.5 | 2.7 |
Impulse Control |
8.7 | 86.6 | 4.8 | -0.5 | 9.3 | -1.4 | 0.4 |
Stress Management Composite |
3.8 | 92.3 | 3.8 | 1.1 | 9.4 | 0.2 | 2.0 |
Flexibility |
3.8 | 91.4 | 4.8 | 0.5 | 11.3 | -0.7 | 1.6 |
Stress Tolerance |
1.9 | 91.3 | 6.7 | 0.7 | 8.9 | -0.2 | 1.6 |
Optimism |
3.8 | 88.5 | 7.7 | 1.5 | 9.9 | 0.5 | 2.4 |
Happiness |
3.8 | 92.3 | 3.8 | 0.8 | 9.8 | -0.2 | 1.8 |
Note. N = 104. M Diff = mean difference; CI = confidence interval; LB = lower bound, UB = upper bound.
Table A.16. Demographic Distributions of EQ-i 2.0 Exploratory and Confirmatory Normative Subsamples
The following table summarizes the demographic characteristics of the subsamples of the EQ-i 2.0 normative sample, created for performing exploratory factor analysis and confirmatory factor analysis. Ideally, the two samples should show similar demographic characteristics, as found in the EQ-i 2.0 exploratory and confirmatory samples.
Demographic |
Exploratory Sample | Confirmatory Sample | ||||
|---|---|---|---|---|---|---|
| N | % | N | % | |||
Gender |
Male | 1,000 | 50.0 | 1,000 | 50.0 | |
| Female | 1,000 | 50.0 | 1,000 | 50.0 | ||
Age Group (Years) |
18–29 | 400 | 20.0 | 400 | 20.0 | |
| 30–39 | 400 | 20.0 | 400 | 20.0 | ||
| 40–49 | 400 | 20.0 | 400 | 20.0 | ||
| 50–59 | 400 | 20.0 | 400 | 20.0 | ||
| 60+ | 400 | 20.0 | 400 | 20.0 | ||
| M (SD) | 44.6 (15.0) | 44.7 (15.2) | ||||
Race/Ethnicity |
Black | 209 | 10.5 | 210 | 10.5 | |
| Hispanic/Latino | 216 | 10.8 | 217 | 10.9 | ||
| White | 1,417 | 70.9 | 1,417 | 70.9 | ||
| Other | 158 | 1.0 | 156 | 1.4 | ||
Education Level |
High School or Less | 877 | 43.9 | 874 | 43.7 | |
| Some College/University | 558 | 27.9 | 561 | 28.1 | ||
| College/University or Higher | 565 | 28.3 | 565 | 28.3 | ||
Geographic Region |
U.S. | Northeast | 314 | 15.7 | 341 | 17.1 |
| Midwest | 409 | 20.5 | 384 | 19.2 | ||
| South | 650 | 32.5 | 642 | 32.1 | ||
| West | 428 | 21.4 | 432 | 21.6 | ||
| Canada | West | 22 | 1.1 | 32 | 1.6 | |
| Prairies | 38 | 1.9 | 34 | 1.7 | ||
| Central | 124 | 6.2 | 120 | 6.0 | ||
| East | 15 | 0.8 | 15 | 0.8 | ||
Total |
2,000 | 100.0 | 2,000 | 100.0 | ||
Table A.17. Confirmatory Factor Analysis Results for EQ-i 2.0
The following table provides the fit statistics generated by the confirmatory factor analyses of the EQ-i 2.0. Values below .100 for the RMSEA and above .900 for all other fit statistics, which were found in the majority of the EQ-i 2.0 models, suggest the factor structure that emerged from the exploratory factor analyses was independently replicated in the confirmatory factor analysis.
Fit Index |
Overall Model | Composites | ||||
|---|---|---|---|---|---|---|
| Self-Perception | Self-Expression | Interpersonal | Decision Making | Stress Management | ||
GFI |
.955 | .963 | .960 | .942 | .979 | .943 |
AGFI |
.864 | .932 | .931 | .900 | .966 | .912 |
NFI |
.966 | .969 | .945 | .940 | .970 | .943 |
NNFI |
.934 | .956 | .929 | .920 | .966 | .931 |
CFI |
.967 | .971 | .949 | .943 | .975 | .947 |
RMSEA |
.152 | .081 | .078 | .096 | .049 | .082 |
Note. N = 2,000. GFI = Goodness of Fit Index (Jöreskog & Sörbom, 1986), AGFI = Adjusted Goodness of Fit Index (Jöreskog & Sörbom, 1986), NFI = Normed Fit Index (Bentler & Bonett, 1980), NNFI = Non-Normed Fit Index (Bentler & Bonett, 1980), CFI = Comparative Fit Index (Bentler, 1990), RMSEA = Root Mean Square Error of Approximation (Steiger & Lind, 1980).
Table A.18. Correlations among EQ-i 2.0 Composite Scales
The following table illustrates the correlations among the EQ-i 2.0 composite scales in the EQ-i 2.0 normative sample. Correlations range from 0.00 to 1.00, with higher values suggesting the scales share a relevant common psychological characteristic (i.e., emotional intelligence). Very high values (e.g., > .90) would suggest a unidimensional factor structure. Moderately sized correlations, like those that were found in the EQ-i 2.0, support both the concept that the scales measure a common psychological characteristic, as well as the multidimensional factor structure of the EQ-i 2.0.
Composite Scale |
SP | SE | IS | DM | SM |
|---|---|---|---|---|---|
| SP. Self-Perception Composite | – | ||||
| SE. Self-Expression Composite | .73 | – | |||
| IS. Interpersonal Composite | .71 | .55 | – | ||
| DM. Decision Making Composite | .70 | .66 | .50 | – | |
| SM. Stress Management Composite | .78 | .67 | .63 | .73 | – |
Note. N = 4,000. All correlations significant at p < .01. Guidelines for evaluating r are .10 = small, .30 = medium, .50 = large.
Table A.19. Correlations among EQ-i 2.0 Subscales
The following table illustrates the correlations among the EQ-i 2.0 subscales in the EQ-i 2.0 normative sample. Correlations range from 0.00 to 1.00, with higher values suggesting the scales share a relevant common psychological characteristic. Shaded cells portray correlations of subscales within their respective composite scales. Moderate correlations were found within the composite scales supporting both the concept that the scales measure a common psychological characteristic, as well as the multidimensional factor structure.
Subscale |
Self-Perception | Self-Expression | Interpersonal | Decision Making | Stress Management | ||||||||||||
|---|---|---|---|---|---|---|---|---|---|---|---|---|---|---|---|---|---|
SR |
SA |
ES |
EE |
AS |
IN |
IR |
EM |
RE |
PS |
RT |
IC |
FL |
ST |
OP |
HA |
||
| SR. Self-Regard | – | ||||||||||||||||
| SA. Self-Actualization | .70 | – | |||||||||||||||
| ES. Emotional Self-Awareness | .43 | .55 | – | ||||||||||||||
| EE. Emotional Expression | .51 | .47 | .46 | – | |||||||||||||
| AS. Assertiveness | .52 | .57 | .45 | .43 | – | ||||||||||||
| IN. Independence | .56 | .47 | .24 | .33 | .47 | – | |||||||||||
| IR. Interpersonal Relationships | .56 | .62 | .52 | .59 | .46 | .31 | – | ||||||||||
| EM. Empathy | .29 | .45 | .64 | .42 | .30 | .10 | .61 | – | |||||||||
| RE. Social Responsibility | .47 | .67 | .47 | .42 | .41 | .27 | .61 | .55 | – | ||||||||
| PS. Problem Solving | .60 | .54 | .32 | .42 | .45 | .73 | .38 | .20 | .34 | – | |||||||
| RT. Reality Testing | .55 | .69 | .76 | .40 | .55 | .40 | .55 | .58 | .53 | .48 | – | ||||||
| IC. Impulse Control | .30 | .24 | .20 | .18 | .12 | .41 | .15 | .19 | .19 | .51 | .27 | – | |||||
| FL. Flexibility | .47 | .44 | .26 | .48 | .26 | .50 | .43 | .27 | .37 | .60 | .32 | .39 | – | ||||
| ST. Stress Tolerance | .59 | .65 | .42 | .34 | .49 | .56 | .46 | .32 | .46 | .67 | .61 | .33 | .50 | – | |||
| OP. Optimism | .73 | .69 | .48 | .47 | .39 | .36 | .61 | .48 | .57 | .49 | .56 | .26 | .48 | .58 | – | ||
| HA. Happiness | .81 | .68 | .43 | .53 | .40 | .40 | .60 | .38 | .52 | .49 | .52 | .24 | .47 | .51 | .81 | – | |
Note. N = 4,000. All correlations significant at p < .01. Guidelines for evaluating r are .10 = small, .30 = medium, .50 = large.
Table A.20. Demographic Characteristics of EQ-i 2.0 Validity Samples
The following table summarizes the demographic characteristics of the samples used in the EQ-i 2.0 validity analyses. Ideally, these samples should include representation from a wide range of demographic groups, as found in the EQ-i 2.0 validity samples.
Demographic |
EQ-i 1.0 | SSI | NEO-FFI | MSCEIT | Watson-Glaser II | ||||||
|---|---|---|---|---|---|---|---|---|---|---|---|
| N | % | N | % | N | % | N | % | N | % | ||
Gender |
Male | 50 | 49.5 | 50 | 49.5 | 50 | 50.0 | 50 | 46.7 | 51 | 50.0 |
| Female | 51 | 50.5 | 51 | 50.5 | 50 | 50.0 | 57 | 53.3 | 51 | 50.0 | |
Age Group (Years) |
18–29 | 2 | 2.0 | 3 | 3.0 | 1 | 1.0 | 6 | 5.6 | 6 | 5.9 |
| 30–39 | 18 | 17.8 | 25 | 24.8 | 23 | 23.0 | 15 | 14.0 | 10 | 9.8 | |
| 40–49 | 29 | 28.7 | 27 | 26.7 | 36 | 36.0 | 24 | 22.4 | 20 | 19.6 | |
| 50–59 | 24 | 23.8 | 17 | 16.8 | 25 | 25.0 | 20 | 18.7 | 28 | 27.5 | |
| 60+ | 28 | 27.7 | 29 | 28.7 | 15 | 15.0 | 42 | 39.3 | 38 | 37.3 | |
| M (SD) | 50.6 (12.8) | 49.7 (13.6) | 47.5 (11.1) | 52.8 (14.1) | 52.8 (13.5) | ||||||
Race/ Ethnicity |
Black | 22 | 21.8 | 21 | 20.8 | 25 | 25.0 | 7 | 6.5 | 10 | 9.8 |
| Hispanic/Latino | 44 | 43.6 | 37 | 36.6 | 54 | 54.0 | 8 | 7.5 | 9 | 8.8 | |
| White | 29 | 28.7 | 38 | 37.6 | 14 | 14.0 | 87 | 81.3 | 77 | 75.5 | |
| Other | 6 | 5.9 | 5 | 5.0 | 7 | 7.0 | 5 | 4.7 | 6 | 5.9 | |
Education Level |
High School or Less | 7 | 6.9 | 15 | 14.9 | 25 | 25.0 | 27 | 25.2 | 72 | 70.6 |
| Some College/University | 43 | 42.6 | 42 | 41.6 | 47 | 47.0 | 30 | 28.0 | 19 | 18.6 | |
| College/University or Higher | 51 | 50.5 | 44 | 43.6 | 28 | 28.0 | 50 | 46.7 | 11 | 10.8 | |
U.S. Geographic Region |
Northeast | 16 | 15.8 | 14 | 13.9 | 10 | 10.0 | 22 | 20.6 | 24 | 23.5 |
| Midwest | 3 | 3.0 | 15 | 14.9 | 6 | 6.0 | 16 | 15.0 | 21 | 20.6 | |
| South | 42 | 41.6 | 38 | 37.6 | 37 | 37.0 | 48 | 44.9 | 37 | 36.3 | |
| West | 40 | 39.6 | 34 | 33.7 | 47 | 47.0 | 21 | 19.6 | 20 | 19.6 | |
Total |
101 | 100.0 | 101 | 100.0 | 100 | 100.0 | 107 | 100.0 | 102 | 100.0 | |
Note. SSI = Social Skills Inventory (Riggio & Carney, 2003); NEO-FFI = NEO Five Factor Inventory (Costa & McCrae, 1992); MSCEIT = Mayer-Salovey-Caruso Emotional Intelligence Test (Mayer et al., 2002).
Table A.21. Correlations between EQ-i 2.0 and EQ-i
The following table illustrates correlations between the EQ-i scales and their corresponding EQ-i 2.0 Total EI Score, composite scales, and subscales. Values range from -1.00 to +1.00; values close to -1.00 represent an inverse relationship between scores on the two scales, values close to +1.00 represent a direct relationship, and values close to zero represent a lack of a relationship. Shaded cells indicate constructs that were relatively unchanged from the EQ-i to the EQ-i 2.0. Unshaded cells indicate constructs that changed substantially from the EQ-i to the EQ-i 2.0. The high positive correlations found between the EQ-i and EQ-i 2.0 support the validity of the EQ-i 2.0.
Scale |
r | EQ-i | EQ-i 2.0 | |||
|---|---|---|---|---|---|---|
| M | SD | M | SD | |||
Total EI |
.90 | 102.3 | 14.5 | 104.6 | 14.3 | |
Self-Perception Composite |
Self-Regard | .88 | 101.4 | 14.4 | 104.1 | 13.1 |
| Self-Actualization | .71 | 100.4 | 13.0 | 105.1 | 13.6 | |
| Emotional Self-Awareness* | .50 | 103.1 | 14.5 | 103.7 | 15.1 | |
Self-Expression Composite |
Emotional Expression* | .84 | N/A | N/A | 102.6 | 16.5 |
| Assertiveness | .65 | 101.4 | 12.7 | 103.9 | 13.5 | |
| Independence | .81 | 104.8 | 13.9 | 104.5 | 13.6 | |
Interpersonal Composite |
Interpersonal Relationships | .86 | 99.8 | 16.2 | 101.9 | 14.2 |
| Empathy | .78 | 96.1 | 14.1 | 101.5 | 15.4 | |
| Social Responsibility | .49 | 100.3 | 13.7 | 104.3 | 14.6 | |
Decision Making Composite |
Problem Solving | .57 | 100.7 | 13.5 | 103.7 | 14.3 |
| Reality Testing | .49 | 104.7 | 13.1 | 103.1 | 15.2 | |
| Impulse Control | .54 | 105.6 | 12.6 | 100.9 | 14.0 | |
Stress Management Composite |
Flexibility | .67 | 102.3 | 15.4 | 102.0 | 13.8 |
| Stress Tolerance | .79 | 103.7 | 14.7 | 103.8 | 14.9 | |
| Optimism | .69 | 98.6 | 14.6 | 103.1 | 13.5 | |
Happiness |
.84 | 102.1 | 14.4 | 102.8 | 13.3 | |
Note. N = 101. All correlations are significant at p < .01. Guidelines for evaluating r are .10 = small, .30 = medium, .50 = large. N/A = not applicable.
*represents correlations with Emotional Self-Awareness on the original EQ-i.
Table A.22. Correlations between the EQ-i 2.0 and the Social Skills Inventory
The following table illustrates correlations between the EQ-i 2.0 Total EI score, composite scales, and subscales, and the Social Skills Inventory (SSI). Values range from -1.00 to +1.00; values close to -1.00 represent an inverse relationship between scores on the two scales, values close to +1.00 represent a direct relationship, and values close to zero represent a lack of a relationship. The positive correlations found between most of the SSI scales (see Standardization, Reliability, and Validity) and the EQ-i 2.0 support the validity of the EQ-i 2.0.
EQ-i 2.0 Scale |
SSI Scale | |||||
|---|---|---|---|---|---|---|
| Total Score | Total Emotional | Total Social | Total Control | Total Expressivity | Total Sensitivity | |
Total EI |
.54 | .54 | .47 | .63 | .47 | .08 |
Self-Perception Composite |
.53 | .51 | .47 | .54 | .48 | .12 |
Self-Regard |
.42 | .44 | .35 | .52 | .43 | -.06 |
Self-Actualization |
.51 | .46 | .49 | .45 | .47 | .19 |
Emotional Self-Awareness |
.37 | .36 | .33 | .35 | .26 | .21 |
Self-Expression Composite |
.47 | .47 | .41 | .53 | .46 | .03 |
Emotional Expression |
.45 | .41 | .43 | .34 | .39 | .26 |
Assertiveness |
.24 | .24 | .21 | .35 | .24 | -.08 |
Independence |
.36 | .41 | .28 | .52 | .39 | -.13 |
Interpersonal Composite |
.64 | .55 | .63 | .50 | .57 | .32 |
Interpersonal Relationships |
.66 | .57 | .63 | .54 | .62 | .25 |
Empathy |
.52 | .46 | .50 | .39 | .38 | .39 |
Social Responsibility |
.46 | .35 | .48 | .35 | .46 | .17 |
Decision Making Composite |
.22 | .29 | .14 | .49 | .13 | -.11 |
Problem Solving |
.29 | .39 | .17 | .55 | .23 | -.14 |
Reality Testing |
.39 | .40 | .34 | .46 | .28 | .13 |
Impulse Control |
-.13 | -.08 | -.15 | .15 | -.19 | -.22 |
Stress Management Composite |
.41 | .46 | .32 | .59 | .35 | -.03 |
Flexibility |
.37 | .40 | .29 | .50 | .33 | -.02 |
Stress Tolerance |
.26 | .33 | .18 | .54 | .14 | -.08 |
Optimism |
.37 | .39 | .30 | .38 | .38 | .02 |
Happiness |
.37 | .39 | .31 | .41 | .41 | -.02 |
Note. N = 101. SSI = Social Skills Inventory (Riggio & Carney, 2003). Correlations of .19 and above are significant at p < .05, correlations of .25 and above are significant at p < .01. Guidelines for evaluating r are .10 = small, .30 = medium, .50 = large.
EQ-i 2.0 Scale |
SSI Scale | |||||
|---|---|---|---|---|---|---|
| Emotional Expressivity | Emotional Sensitivity | Emotional Control | Social Expressivity | Social Sensitivity | Social Control | |
Total EI |
.28 | .46 | .28 | .53 | -.35 | .65 |
Self-Perception Composite |
.33 | .43 | .19 | .50 | -.26 | .60 |
Self-Regard |
.27 | .29 | .28 | .47 | -.39 | .51 |
Self-Actualization |
.34 | .44 | .06 | .48 | -.16 | .57 |
Emotional Self-Awareness |
.19 | .36 | .12 | .27 | -.03 | .40 |
Self-Expression Composite |
.35 | .41 | .12 | .45 | -.38 | .63 |
Emotional Expression |
.33 | .41 | .00 | .37 | -.01 | .46 |
Assertiveness |
.14 | .25 | .06 | .27 | -.38 | .44 |
Independence |
.30 | .27 | .21 | .39 | -.50 | .55 |
Interpersonal Composite |
.34 | .53 | .15 | .63 | -.03 | .58 |
Interpersonal Relationships |
.36 | .52 | .19 | .69 | -.14 | .60 |
Empathy |
.22 | .49 | .14 | .42 | .11 | .43 |
Social Responsibility |
.28 | .33 | .03 | .50 | -.07 | .46 |
Decision Making Composite |
-.01 | .23 | .35 | .20 | -.43 | .41 |
Problem Solving |
.12 | .27 | .36 | .26 | -.52 | .49 |
Reality Testing |
.16 | .37 | .21 | .32 | -.18 | .47 |
Impulse Control |
-.28 | -.09 | .22 | -.10 | -.26 | .03 |
Stress Management Composite |
.16 | .35 | .37 | .42 | -.42 | .52 |
Flexibility |
.16 | .30 | .31 | .39 | -.35 | .45 |
Stress Tolerance |
.01 | .22 | .41 | .20 | -.37 | .44 |
Optimism |
.22 | .32 | .20 | .42 | -.30 | .38 |
Happiness |
.27 | .24 | .23 | .43 | -.28 | .38 |
Note. N = 101. SSI = Social Skills Inventory (Riggio & Carney, 2003). Correlations of .19 and above are significant at p < .05, correlations of .25 and above are significant at p < .01. Guidelines for evaluating r are .10 = small, .30 = medium, .50 = large.
Table A.23. Correlations between EQ-i 2.0 and NEO Five Factor Inventory
The following table illustrates correlations between the EQ-i 2.0 Total EI score, composite scales, and subscales, and the NEO Five Factor Inventory (NEO-FFI). Values range from -1.00 to +1.00; values close to -1.00 represent an inverse relationship between scores on the two scales, values close to +1.00 represent a direct relationship, and values close to zero represent a lack of a relationship. The positive correlations found between most of the NEO-FFI scales (see Standardization, Reliability, and Validity) and the EQ-i 2.0 support the validity of the EQ-i 2.0.
EQ-i 2.0 Scale |
NEO-FFI Scale | ||||
|---|---|---|---|---|---|
| Neuroticism | Extraversion | Openness to Experience | Agreeableness | Conscientiousness | |
Total EI |
-.71 | .57 | .10 | .36 | .61 |
Self-Perception Composite |
-.65 | .61 | .17 | .27 | .63 |
Self-Regard |
-.68 | .57 | .04 | .21 | .46 |
Self-Actualization |
-.53 | .54 | .18 | .18 | .63 |
Emotional Self-Awareness |
-.39 | .38 | .22 | .32 | .50 |
Self-Expression Composite |
-.57 | .45 | .14 | .15 | .46 |
Emotional Expression |
-.39 | .45 | .19 | .29 | .32 |
Assertiveness |
-.43 | .33 | .02 | -.09 | .44 |
Independence |
-.55 | .26 | .09 | .09 | .35 |
Interpersonal Composite |
-.49 | .54 | .04 | .51 | .51 |
Interpersonal Relationships |
-.51 | .54 | -.12 | .50 | .45 |
Empathy |
-.29 | .38 | .08 | .47 | .42 |
Social Responsibility |
-.49 | .46 | .16 | .30 | .43 |
Decision Making Composite |
-.64 | .29 | -.03 | .29 | .53 |
Problem Solving |
-.50 | .21 | .02 | .14 | .36 |
Reality Testing |
-.58 | .48 | .11 | .27 | .59 |
Impulse Control |
-.35 | -.03 | -.20 | .25 | .25 |
Stress Management Composite |
-.71 | .53 | .10 | .30 | .48 |
Flexibility |
-.56 | .38 | .09 | .23 | .41 |
Stress Tolerance |
-.58 | .38 | .07 | .17 | .41 |
Optimism |
-.61 | .56 | .10 | .34 | .38 |
Happiness |
-.64 | .49 | .05 | .13 | .44 |
Note. N = 100. NEO-FFI = NEO Five Factor Inventory (Costa & McCrae, 1992). Correlations of .19 and above are significant at p < .05, correlations of .25 and above are significant at p < .01. Guidelines for evaluating r are .10 = small, .30 = medium, .50 = large.
Table A.24. Correlations between EQ-i 2.0 and Mayer-Salovey-Caruso Emotional Intelligence Test - Expert Consensus Scores: Total, Area, and Branch Scores
The following table illustrates correlations between the EQ-i 2.0 Total EI score, composite scales, and subscales, and the Mayer-Salovey-Caruso Emotional Intelligence Test (MSCEIT; Total, Area, and Branch Scores). Values range from -1.00 to +1.00; values close to -1.00 represent an inverse relationship between scores on the two scales, values close to +1.00 represent a direct relationship, and values close to zero represent a lack of a relationship. The correlations close to zero found between most of the MSCEIT scores (see Standardization, Reliability, and Validity) and the EQ-i 2.0 support the validity of the EQ-i 2.0.
EQ-i 2.0 Scale |
MSCEIT Scale | ||||||
|---|---|---|---|---|---|---|---|
| Total EIQ | Area Scores | Branch Scores | |||||
| Experiential | Strategic | ||||||
| Experiential | Strategic | Perceiving Emotions | Facilitating Thought | Understanding Emotions | Managing Emotions | ||
Total EI |
.12 | .15 | .04 | .12 | .15 | -.04 | .17 |
Self-Perception Composite |
.06 | .11 | .00 | .06 | .16 | -.07 | .10 |
Self-Regard |
-.01 | .07 | -.11 | .06 | .06 | -.17 | .02 |
Self-Actualization |
.03 | .06 | -.02 | .03 | .12 | -.10 | .12 |
Emotional Self-Awareness |
.21 | .19 | .20 | .08 | .31 | .16 | .16 |
Self-Expression Composite |
.05 | .07 | .02 | .05 | .04 | -.05 | .13 |
Emotional Expression |
.13 | .14 | .09 | .07 | .19 | .01 | .18 |
Assertiveness |
-.06 | -.03 | -.06 | -.02 | -.07 | -.08 | -.01 |
Independence |
.02 | .04 | .01 | .05 | -.05 | -.05 | .12 |
Interpersonal Composite |
.07 | .08 | .01 | .03 | .15 | -.05 | .12 |
Interpersonal Relationships |
-.09 | -.02 | -.17 | -.04 | .03 | -.23 | .01 |
Empathy |
.14 | .11 | .14 | .05 | .20 | .07 | .19 |
Social Responsibility |
.17 | .14 | .12 | .10 | .20 | .08 | .14 |
Decision Making Composite |
.27 | .27 | .16 | .27 | .18 | .09 | .24 |
Problem Solving |
.16 | .15 | .11 | .17 | .00 | .03 | .24 |
Reality Testing |
.19 | .23 | .07 | .19 | .25 | .06 | .08 |
Impulse Control |
.23 | .22 | .16 | .24 | .14 | .10 | .20 |
Stress Management Composite |
.09 | .12 | .01 | .11 | .09 | -.05 | .14 |
Flexibility |
.04 | .02 | .05 | .02 | -.06 | .02 | .10 |
Stress Tolerance |
.09 | .11 | .04 | .09 | .12 | .02 | .09 |
Optimism |
.08 | .14 | -.04 | .13 | .12 | -.14 | .14 |
Happiness |
.11 | .16 | .01 | .17 | .09 | -.08 | .16 |
Note. N = 107. MSCEIT = Mayer-Salovey-Caruso Emotional Intelligence Test (Mayer et al., 2002). Correlations of .19 and above significant at p < .05, correlations of .25 and above significant at p < .01. Guidelines for evaluating r are .10 = small, .30 = medium, .50 = large.
Table A.25. Correlations between EQ-i 2.0 and Mayer-Salovey-Caruso Emotional Intelligence Test - Expert Consensus Scores: Task Scores
The following table illustrates correlations between the EQ-i 2.0 Total EI score, composite scales, and subscales, and the Mayer-Salovey-Caruso Emotional Intelligence Test (MSCEIT; Task Scores). Values range from -1.00 to +1.00; values close to -1.00 represent an inverse relationship between scores on the two scales, values close to +1.00 represent a direct relationship, and values close to zero represent a lack of a relationship. The correlations close to zero found between most of the MSCEIT scores (see Standardization, Reliability, and Validity) and the EQ-i 2.0 support the validity of the EQ-i 2.0.
EQ-i 2.0 Scale |
MSCEIT Task Score | |||||||
|---|---|---|---|---|---|---|---|---|
| Experiential | Strategic | |||||||
| Perceiving Emotions | Facilitating Thought | Understanding Emotions | Managing Emotions | |||||
| Faces | Pictures | Sensation | Facilitation | Changes | Blends | Emotional Management | Emotional Relations | |
Total EI |
.17 | -.03 | .18 | .10 | -.10 | .00 | .09 | .16 |
Self-Perception Composite |
.10 | -.04 | .15 | .13 | -.11 | -.04 | .02 | .11 |
Self-Regard |
.10 | -.03 | .05 | .08 | -.20 | -.11 | -.04 | .02 |
Self-Actualization |
.07 | -.06 | .12 | .08 | -.09 | -.10 | .03 | .14 |
Emotional Self-Awareness |
.10 | .00 | .27 | .24 | .05 | .19 | .10 | .15 |
Self-Expression Composite |
.12 | -.10 | .09 | .04 | -.12 | .01 | .03 | .14 |
Emotional Expression |
.17 | -.11 | .17 | .16 | -.11 | .07 | .12 | .16 |
Assertiveness |
.01 | -.06 | .03 | -.10 | -.10 | -.05 | -.06 | -.01 |
Independence |
.08 | -.05 | -.02 | .00 | -.07 | -.01 | -.01 | .16 |
Interpersonal Composite |
.12 | -.13 | .18 | .05 | -.13 | -.01 | .14 | .07 |
Interpersonal Relationships |
.05 | -.16 | .03 | .02 | -.26 | -.17 | .02 | -.02 |
Empathy |
.12 | -.10 | .25 | .04 | -.04 | .11 | .24 | .12 |
Social Responsibility |
.17 | -.05 | .23 | .07 | .02 | .08 | .12 | .11 |
Decision Making Composite |
.29 | .11 | .22 | .14 | .03 | .10 | .15 | .24 |
Problem Solving |
.22 | .00 | .04 | .06 | .03 | .03 | .14 | .22 |
Reality Testing |
.17 | .11 | .26 | .17 | .00 | .08 | .02 | .11 |
Impulse Control |
.24 | .13 | .19 | .07 | .03 | .11 | .16 | .18 |
Stress Management Composite |
.11 | .04 | .13 | .07 | -.08 | -.02 | .07 | .15 |
Flexibility |
.05 | .01 | -.02 | .00 | -.06 | .05 | .02 | .14 |
Stress Tolerance |
.05 | .09 | .18 | .05 | .06 | -.01 | .04 | .11 |
Optimism |
.15 | .01 | .13 | .10 | -.18 | -.07 | .09 | .12 |
Happiness |
.20 | .03 | .12 | .04 | -.11 | -.07 | .08 | .14 |
Note. N = 107. MSCEIT = Mayer-Salovey-Caruso Emotional Intelligence Test (Mayer et al., 2002). Correlations of .19 and above significant at p < .05, correlations of .25 and above significant at p < .01. Guidelines for evaluating r are .10 = small, .30 = medium, .50 = large.
Table A.26. Correlations between EQ-i 2.0 and Watson-Glaser II Critical Thinking Appraisal
The following table illustrates correlations between the EQ-i 2.0 Total EI score, composite scales, and subscales, and the Watson-Glaser II Critical Thinking Appraisal. Values range from -1.00 to +1.00; values close to -1.00 represent an inverse relationship between scores on the two scales, values close to +1.00 represent a direct relationship, and values close to zero represent a lack of a relationship. For most Watson-Glaser II scales (see Standardization, Reliability, and Validity), the correlations close to zero found between most of the Watson-Glaser II scales (see Standardization, Reliability, and Validity) and the EQ-i 2.0 support the validity of the EQ-i 2.0.
EQ-i 2.0 Scale |
Watson-Glaser II Critical Thinking Appraisal Scale | |||
|---|---|---|---|---|
| Total | Recognize Assumptions | Evaluate Arguments | Draw Conclusions | |
Total EI |
-.05 | .03 | -.25 | .02 |
Self-Perception Composite |
-.10 | .02 | -.23 | -.06 |
Self-Regard |
-.06 | .10 | -.16 | -.11 |
Self-Actualization |
-.07 | .00 | -.20 | -.01 |
Emotional Self-Awareness |
-.14 | -.09 | -.24 | -.04 |
Self-Expression Composite |
-.02 | .06 | -.17 | -.01 |
Emotional Expression |
-.07 | -.03 | -.12 | -.02 |
Assertiveness |
-.07 | .03 | -.18 | -.06 |
Independence |
.09 | .15 | -.10 | .06 |
Interpersonal Composite |
-.13 | -.08 | -.25 | -.01 |
Interpersonal Relationships |
-.12 | -.04 | -.22 | -.06 |
Empathy |
-.09 | -.05 | -.23 | .02 |
Social Responsibility |
-.10 | -.12 | -.16 | .04 |
Decision Making Composite |
.03 | .08 | -.17 | .08 |
Problem Solving |
.10 | .16 | -.19 | .13 |
Reality Testing |
-.05 | .00 | -.26 | .06 |
Impulse Control |
.04 | .04 | .03 | .01 |
Stress Management Composite |
.03 | .07 | -.23 | .11 |
Flexibility |
-.04 | .02 | -.25 | .05 |
Stress Tolerance |
.15 | .14 | -.13 | .22 |
Optimism |
-.06 | .01 | -.19 | -.01 |
Happiness |
-.05 | .04 | -.13 | -.05 |
Note. N = 102. Correlations of .19 and above are significant at p < .05, correlations of .25 and above are significant at p < .01. Guidelines for evaluating r are .10 = small, .30 = medium, .50 = large.
Table A.27. Demographic Characteristics of Corporate Leaders Sample
The following table summarizes the demographic characteristics of the corporate leaders sample. Ideally, this sample should include leaders representing a wide range of demographic groups, as found in our corporate leaders sample.
Demographic |
N | % | |
|---|---|---|---|
Gender |
Male | 143 | 64.7 |
| Female | 78 | 35.3 | |
Age Group (Years) |
18–29 | 16 | 7.2 |
| 30–39 | 48 | 21.7 | |
| 40–49 | 61 | 27.6 | |
| 50–59 | 66 | 29.9 | |
| 60+ | 30 | 13.6 | |
| M (SD) | 46.8 (11.4) | ||
Race/Ethnicity |
Black | 11 | 5.0 |
| Hispanic/Latino | 8 | 3.6 | |
| White | 175 | 79.2 | |
| Other | 26 | 11.8 | |
| Missing | 1 | 0.5 | |
Education Level |
High School or Less | 4 | 1.8 |
| Some College/University | 27 | 12.2 | |
| College/University or Higher | 189 | 85.5 | |
| Missing | 1 | 0.5 | |
Occupational Position |
CEO | 64 | 29.0 |
| Other C-level (CFO, COO, etc.) | 18 | 8.1 | |
| Senior Executive | 33 | 14.9 | |
| Director | 44 | 19.9 | |
| Manager | 44 | 19.9 | |
| Other | 16 | 7.2 | |
| Missing | 2 | 0.9 | |
Total |
221 | 100.0 | |
Table A.28. EQ-i 2.0 Scores in Corporate Leaders
The following table displays the means and standard deviations of the EQ-i 2.0 Total EI score, composite scales, and subscales in the corporate leaders sample used in validity analyses of the EQ-i 2.0. d values provide an effect size to describe the difference between leaders’ scores and those in the normative sample (M = 100, SD = 15) as small, medium, or large. The meaningfully higher scores (i.e., d ≥ .20) found in leaders relative to the normative sample supports the validity of the EQ-i 2.0.
Scale |
Corporate Leaders | Cohen’s d (Relative to Norms) |
|
|---|---|---|---|
Total EI |
M | 112.2 | 0.82 |
| SD | 11.7 | ||
Self-Perception Composite |
M | 111.4 | 0.77 |
| SD | 11.4 | ||
Self-Regard |
M | 108.3 | 0.56 |
| SD | 10.8 | ||
Self-Actualization |
M | 113.1 | 0.88 |
| SD | 10.4 | ||
Emotional Self-Awareness |
M | 107.0 | 0.47 |
| SD | 14.7 | ||
Self-Expression Composite |
M | 110.8 | 0.73 |
| SD | 11.4 | ||
Emotional Expression |
M | 107.5 | 0.50 |
| SD | 12.9 | ||
Assertiveness |
M | 109.5 | 0.64 |
| SD | 12.0 | ||
Independence |
M | 108.4 | 0.57 |
| SD | 11.6 | ||
Interpersonal Composite |
M | 109.2 | 0.62 |
| SD | 11.8 | ||
Interpersonal Relationships |
M | 108.3 | 0.56 |
| SD | 10.9 | ||
Empathy |
M | 106.2 | 0.41 |
| SD | 13.6 | ||
Social Responsibility |
M | 109.6 | 0.64 |
| SD | 12.4 | ||
Decision Making Composite |
M | 109.6 | 0.64 |
| SD | 13.0 | ||
Problem Solving |
M | 109.3 | 0.63 |
| SD | 12.4 | ||
Reality Testing |
M | 109.0 | 0.60 |
| SD | 12.4 | ||
Impulse Control |
M | 104.2 | 0.28 |
| SD | 14.0 | ||
Stress Management Composite |
M | 111.1 | 0.75 |
| SD | 12.7 | ||
Flexibility |
M | 107.4 | 0.49 |
| SD | 13.4 | ||
Stress Tolerance |
M | 110.5 | 0.70 |
| SD | 13.2 | ||
Optimism |
M | 109.5 | 0.64 |
| SD | 11.5 | ||
Happiness |
M | 106.9 | 0.46 |
| SD | 11.1 | ||
Note. Positive Cohen's d values represent higher mean scores in corporate leaders. Guidelines for evaluating |d| are .20 = small, .50 = medium, .80 = large.
Table A.29. Education Level Effects on EQ-i 2.0 Scores in the Normative Sample
The following table displays the means and standard deviations of EQ-i 2.0 Total EI scores, composite scales, and subscales in normative participants with a high school education or less and those with a post-secondary college/university degree. d values provide an effect size for describing differences between the two groups as small, medium, or large. The meaningfully higher scores (i.e., d ≥ .20) found in post-secondary graduates relative to individuals with a high school education or less supports the validity of the EQ-i 2.0.
Scale |
High School or Less | Post-secondary Graduate | Cohen’s d | |
|---|---|---|---|---|
Total EI |
M | 98.1 | 103.2 | 0.33 |
| SD | 15.5 | 14.8 | ||
Self-Perception Composite |
M | 98.0 | 103.8 | 0.38 |
| SD | 15.5 | 14.8 | ||
Self-Regard |
M | 98.4 | 102.4 | 0.26 |
| SD | 15.4 | 14.7 | ||
Self Actualization |
M | 97.5 | 105.7 | 0.54 |
| SD | 15.5 | 14.8 | ||
Emotional Self-Awareness |
M | 99.5 | 101.2 | 0.11 |
| SD | 15.7 | 15.0 | ||
Self-Expression Composite |
M | 99.0 | 100.4 | 0.09 |
| SD | 15.7 | 15.0 | ||
Emotional Expression |
M | 99.1 | 99.6 | 0.03 |
| SD | 15.6 | 14.9 | ||
Assertiveness |
M | 99.5 | 100.3 | 0.06 |
| SD | 15.7 | 15.0 | ||
Independence |
M | 99.3 | 101.2 | 0.12 |
| SD | 15.4 | 14.7 | ||
Interpersonal Composite |
M | 98.7 | 102.2 | 0.23 |
| SD | 15.5 | 14.8 | ||
Interpersonal Relationships |
M | 99.8 | 99.1 | -0.05 |
| SD | 15.7 | 15.0 | ||
Empathy |
M | 99.1 | 101.9 | 0.19 |
| SD | 15.4 | 14.7 | ||
Social Responsibility |
M | 97.4 | 105.3 | 0.52 |
| SD | 15.5 | 14.8 | ||
Decision Making Composite |
M | 98.3 | 104.2 | 0.38 |
| SD | 15.6 | 14.9 | ||
Problem Solving |
M | 98.7 | 102.1 | 0.22 |
| SD | 15.4 | 14.7 | ||
Reality Testing |
M | 98.4 | 103.7 | 0.34 |
| SD | 15.7 | 15.0 | ||
Impulse Control |
M | 99.0 | 104.2 | 0.33 |
| SD | 15.8 | 15.1 | ||
Stress Management Composite |
M | 97.9 | 103.0 | 0.33 |
| SD | 15.6 | 14.9 | ||
Flexibility |
M | 99.2 | 100.6 | 0.10 |
| SD | 15.7 | 15.0 | ||
Stress Tolerance |
M | 97.5 | 104.1 | 0.43 |
| SD | 15.4 | 14.7 | ||
Optimism |
M | 98.4 | 102.6 | 0.27 |
| SD | 15.6 | 14.9 | ||
Happiness |
M | 98.9 | 101.7 | 0.18 |
| SD | 15.7 | 15.0 | ||
Note. Sample sizes vary due to missing data: High school or less, N = 1,748–1,751; Post-secondary Graduate, N = 402. Positive d values represent higher scores in post-secondary graduates, negative d values represent higher scores in high school or less group.
Table A.30. Demographic Characteristics of EQ-i 2.0 Clinical and Matched General Population Samples
The following table summarizes the demographic characteristics of the depressed/dysthymic, other clinical, and matched general population groups used in validity analyses of the EQ-i 2.0. Ideally, these groups should include representation from a wide range of demographic groups, and the general population group should be demographically similar to the depressed/dysthymic and other clinical groups, as was the case in the samples.
Demographic |
Depressed/Dysthymic | Other Clinical | Matched General Population | ||||
|---|---|---|---|---|---|---|---|
| N | % | N | % | N | % | ||
Gender |
Male | 33 | 42.9 | 27 | 54.0 | 49 | 49.0 |
| Female | 44 | 57.1 | 23 | 46.0 | 51 | 51.0 | |
Age Group (Years) |
18–29 | 12 | 15.6 | 9 | 18.0 | 17 | 17.0 |
| 30–39 | 14 | 18.2 | 10 | 20.0 | 18 | 18.0 | |
| 40–49 | 14 | 18.2 | 9 | 18.0 | 19 | 19.0 | |
| 50–59 | 21 | 27.3 | 7 | 14.0 | 20 | 20.0 | |
| 60+ | 16 | 20.8 | 15 | 30.0 | 26 | 26.0 | |
| M (SD) | 46.2 (15.1) | 46.2 (14.7) | 46.3 (14.8) | ||||
Race/ Ethnicity |
Black | 0 | 0.0 | 0 | 0.0 | 0 | 0.0 |
| Hispanic/Latino | 1 | 1.3 | 3 | 6.0 | 4 | 4.0 | |
| White | 72 | 93.5 | 43 | 86.0 | 89 | 89.0 | |
| Other | 4 | 5.2 | 4 | 8.0 | 7 | 7.0 | |
Education Level |
High School or Less | 5 | 6.5 | 6 | 12.0 | 30 | 30.0 |
| Some College/University | 24 | 31.2 | 19 | 38.0 | 28 | 28.0 | |
| College/University or Higher | 48 | 62.3 | 25 | 50.0 | 42 | 42.0 | |
U.S. Geographic Region |
Northeast | 19 | 24.7 | 11 | 22.0 | 21 | 21.0 |
| Midwest | 12 | 15.6 | 13 | 26.0 | 25 | 25.0 | |
| South | 26 | 33.8 | 13 | 26.0 | 31 | 31.0 | |
| West | 20 | 26.0 | 13 | 26.0 | 23 | 23.0 | |
Total |
77 | 100.0 | 50 | 100.0 | 100 | 100.0 | |
Table A.31. EQ-i 2.0 Clinical Differences
The following table provides means and standard deviations of EQ-i 2.0 Total EI scores, composite scales, and subscales in the depressed/dysthymic, other clinical, and matched general population samples. F and p values provide statistical significance tests for the overall difference among the groups. d values provide an effect size for evaluating differences as small, medium, or large. Validity of the EQ-i 2.0 is supported by the meaningfully higher scores (i.e., d ≥ .20) found in the general population group relative to the depressed/dysthymic and other clinical groups for most EQ-i 2.0 scales.
Scale |
DD. Depressed/Dysthymic | OC. Other Clinical | GP. General Population | F (2, 221) |
p | Cohen’s d | ||
|---|---|---|---|---|---|---|---|---|
| GP vs DD | GP vs OC | |||||||
Total EI |
M | 88.9 | 90.9 | 98.3 | 7.89 | < .001 | 0.57 | 0.45 |
| SD | 16.5 | 16.5 | 16.5 | |||||
Self-Perception Composite |
M | 87.0 | 92.6 | 98.1 | 9.35 | < .001 | 0.66 | 0.32 |
| SD | 16.9 | 16.9 | 16.8 | |||||
Self-Regard |
M | 84.6 | 89.6 | 99.4 | 19.51 | < .001 | 0.93 | 0.61 |
| SD | 16.0 | 16.0 | 16.0 | |||||
Self-Actualization |
M | 89.7 | 95.5 | 97.9 | 4.96 | .008 | 0.47 | 0.14 |
| SD | 17.2 | 17.2 | 17.1 | |||||
Emotional Self-Awareness |
M | 94.6 | 97.6 | 97.5 | 0.73 | .481 | 0.17 | -0.01 |
| SD | 17.1 | 17.1 | 17.0 | |||||
Self-Expression Composite |
M | 94.2 | 92.6 | 99.7 | 4.58 | .011 | 0.36 | 0.46 |
| SD | 15.5 | 15.5 | 15.4 | |||||
Emotional Expression |
M | 97.5 | 96.0 | 99.3 | 0.82 | .441 | 0.12 | 0.21 |
| SD | 15.5 | 15.5 | 15.4 | |||||
Assertiveness |
M | 96.7 | 93.7 | 99.7 | 2.24 | .109 | 0.18 | 0.36 |
| SD | 16.6 | 16.6 | 16.6 | |||||
Independence |
M | 92.3 | 92.8 | 100.4 | 7.83 | .001 | 0.54 | 0.51 |
| SD | 15.1 | 15.1 | 15.0 | |||||
Interpersonal Composite |
M | 93.6 | 97.0 | 97.5 | 1.28 | .281 | 0.23 | 0.03 |
| SD | 16.6 | 16.6 | 16.5 | |||||
Interpersonal Relationships |
M | 89.8 | 92.4 | 97.9 | 5.66 | .004 | 0.50 | 0.34 |
| SD | 16.4 | 16.4 | 16.3 | |||||
Empathy |
M | 96.1 | 99.4 | 97.5 | 0.54 | .586 | 0.08 | -0.11 |
| SD | 17.4 | 17.4 | 17.4 | |||||
Social Responsibility |
M | 98.7 | 101.3 | 98.2 | 0.70 | .497 | -0.03 | -0.20 |
| SD | 15.6 | 15.5 | 15.5 | |||||
Decision Making Composite |
M | 89.5 | 88.4 | 99.2 | 10.31 | < .001 | 0.58 | 0.64 |
| SD | 16.7 | 16.7 | 16.7 | |||||
Problem Solving |
M | 90.1 | 89.7 | 99.9 | 11.19 | < .001 | 0.62 | 0.65 |
| SD | 15.8 | 15.7 | 15.7 | |||||
Reality Testing |
M | 92.4 | 97.0 | 97.8 | 2.59 | .077 | 0.33 | 0.05 |
| SD | 16.2 | 16.2 | 16.1 | |||||
Impulse Control |
M | 92.9 | 86.7 | 100.2 | 11.44 | < .001 | 0.43 | 0.80 |
| SD | 16.9 | 16.9 | 16.8 | |||||
Stress Management Composite |
M | 88.6 | 89.9 | 98.6 | 8.94 | < .001 | 0.59 | 0.52 |
| SD | 17.0 | 17.0 | 16.9 | |||||
Flexibility |
M | 94.3 | 90.1 | 99.6 | 6.22 | .002 | 0.33 | 0.59 |
| SD | 16.1 | 16.1 | 16.0 | |||||
Stress Tolerance |
M | 90.5 | 90.7 | 98.8 | 6.59 | .002 | 0.49 | 0.48 |
| SD | 16.9 | 16.9 | 16.8 | |||||
Optimism |
M | 87.5 | 94.0 | 98.4 | 8.44 | < .001 | 0.62 | 0.25 |
| SD | 17.5 | 17.5 | 17.5 | |||||
Happiness |
M | 85.0 | 91.1 | 98.8 | 13.75 | < .001 | 0.79 | 0.44 |
| SD | 17.5 | 17.4 | 17.4 | |||||
Note. Depressed/Dysthymic N = 77, Other Clinical N = 50, General Population N = 100. Positive Cohen's d values represent higher mean scores in general population group. Guidelines for evaluating |d| are .20 = small, .50 = medium, .80 = large.
Table A.32. EQ-i 2.0 Scores by Racial/Ethnic Group in the Normative Sample
The following table displays means and standard deviations of the EQ-i 2.0 Total EI score, composite scales, and subscales in the Black, Hispanic/Latino, and White participants from the EQ-i 2.0 normative sample. F values provide statistical significance tests for the overall differences among racial/ethnic groups. Partial η2 values provide an effect size for describing the overall effect of race/ethnicity as small, medium, or large. Partial η2 values between .01 and .06, as found in the EQ-i 2.0 normative sample, suggest that any racial/ethnic differences in EQ-i 2.0 scores are small.
Scale |
Black | Hispanic/ Latino | White | F (2, 3680) |
Partial η2 | |
|---|---|---|---|---|---|---|
Total EI |
M | 105.7 | 104.3 | 98.8 | 57.68 | .03 |
| SD | 14.7 | 14.9 | 14.7 | |||
Self-Perception Composite |
M | 106.0 | 104.6 | 98.5 | 68.81 | .04 |
| SD | 14.7 | 15.0 | 14.8 | |||
Self-Regard |
M | 105.8 | 104.5 | 98.5 | 65.81 | .03 |
| SD | 14.6 | 14.9 | 14.7 | |||
Self-Actualization |
M | 104.8 | 104.2 | 98.7 | 49.28 | .03 |
| SD | 14.7 | 14.9 | 14.7 | |||
Emotional Self-Awareness |
M | 104.4 | 102.8 | 99.1 | 30.48 | .02 |
| SD | 14.8 | 15.1 | 14.9 | |||
Self-Expression Composite |
M | 105.9 | 104.0 | 98.9 | 55.51 | .03 |
| SD | 14.8 | 15.0 | 14.8 | |||
Emotional Expression |
M | 102.8 | 103.0 | 99.3 | 18.30 | .01 |
| SD | 14.8 | 15.1 | 14.9 | |||
Assertiveness |
M | 104.7 | 103.3 | 99.0 | 36.59 | .02 |
| SD | 14.8 | 15.1 | 14.9 | |||
Independence |
M | 106.5 | 103.1 | 99.0 | 57.08 | .03 |
| SD | 14.5 | 14.7 | 14.5 | |||
Interpersonal Composite |
M | 103.3 | 103.7 | 99.2 | 27.17 | .01 |
| SD | 14.7 | 14.9 | 14.7 | |||
Interpersonal Relationships |
M | 103.8 | 104.0 | 99.2 | 32.03 | .02 |
| SD | 14.8 | 15.0 | 14.8 | |||
Empathy |
M | 101.4 | 102.2 | 99.6 | 7.53 | .00 |
| SD | 14.5 | 14.8 | 14.6 | |||
Social Responsibility |
M | 103.3 | 103.2 | 99.0 | 26.25 | .01 |
| SD | 14.7 | 14.9 | 14.7 | |||
Decision Making Composite |
M | 105.2 | 102.2 | 99.3 | 32.32 | .02 |
| SD | 14.6 | 14.9 | 14.7 | |||
Problem Solving |
M | 104.4 | 101.9 | 99.5 | 23.44 | .01 |
| SD | 14.5 | 14.7 | 14.5 | |||
Reality Testing |
M | 104.0 | 102.5 | 99.3 | 24.29 | .01 |
| SD | 14.8 | 15.1 | 14.9 | |||
Impulse Control |
M | 103.7 | 100.8 | 99.7 | 13.42 | .01 |
| SD | 14.9 | 15.2 | 15.0 | |||
Stress Management Composite |
M | 104.1 | 103.9 | 99.0 | 36.11 | .02 |
| SD | 14.8 | 15.0 | 14.8 | |||
Flexibility |
M | 103.8 | 103.4 | 99.1 | 28.07 | .02 |
| SD | 15.0 | 15.2 | 15.0 | |||
Stress Tolerance |
M | 102.9 | 102.6 | 99.4 | 17.36 | .01 |
| SD | 14.6 | 14.8 | 14.6 | |||
Optimism |
M | 103.5 | 103.7 | 99.1 | 29.30 | .02 |
| SD | 14.8 | 15.1 | 14.9 | |||
Happiness |
M | 101.6 | 104.4 | 99.2 | 23.92 | .01 |
| SD | 14.9 | 15.2 | 15.0 | |||
Note. Samples sizes vary due to missing data: Black, N = 419, Hispanic/Latino, N = 433, White, N = 2,831–2,834. All F-test values significant at p < .001. Guidelines for evaluating partial η2 are .01 = small; .06 = medium; .14 = large.
Table A.33. Comparison of Simulation and Control Samples on EQ-i 2.0 Positive Impression and Negative Impression Scale Scores
The following table provides the means and standard deviations for the control and simulation (i.e., fake good/fake bad) groups for the EQ-i 2.0 Positive Impression (PI) and Negative Impression (NI) scales. F and p values provide statistical significance tests for the difference between groups. d values provide an effect size for evaluating differences as small, medium, or large. The validity of the PI and NI scales is supported by the meaningfully higher scores (i.e., d ≥ .20) found in the simulation group relative to the control group.
Response Style Scale |
Control Group | Simulation | F (1, 194) | p | d | ||
|---|---|---|---|---|---|---|---|
| M | SD | M | SD | ||||
| Positive Impression | 0.2 | 0.9 | 0.6 | 0.9 | 9.36 | .003 | 0.61 |
| Negative Impression | 0.2 | 1.3 | 1.2 | 1.3 | 31.69 | < .001 | 1.12 |
Note. N = 100 for each group. Positive Cohen's d values represent higher means in simulation samples. Guidelines for evaluating |d| are .20 = small, .50 = medium, .80 = large.
Table A.34. Frequencies and Descriptive Statistics of Inconsistency Index Scores in EQ-i 2.0 Normative and Random Samples
The following table displays the proportion of participants in the EQ-i 2.0 normative sample and the sample of computer-generated random EQ-i 2.0 responses at each score on the EQ-i 2.0 Inconsistency Index (IncX). The mean and standard deviation of the IncX for each sample is also provided. d provides an effect size for evaluating the difference between the IncX scores of the two groups as small, medium, or large. The validity of the IncX scale is supported by the meaningfully higher scores (i.e., d ≥ .20) found in the random sample relative to the normative sample. The validity of the choice of IncX scale cutoff (i.e., 3) for identifying participants as potentially invalid would also be supported if it classifies a high proportion of random respondents as potentially invalid, as found in the EQ-i 2.0.
Inconsistency Index Score |
Normative Sample | Random Sample | ||
|---|---|---|---|---|
| N | % | N | % | |
| 10 | 0 | 0.0 | 1 | 0.0 |
| 9 or higher | 0 | 0.0 | 28 | 0.7 |
| 8 or higher | 1 | 0.0 | 152 | 3.8 |
| 7 or higher | 3 | 0.1 | 543 | 13.6 |
| 6 or higher | 5 | 0.1 | 1,293 | 32.3 |
| 5 or higher | 23 | 0.6 | 2,287 | 57.2 |
| 4 or higher | 60 | 1.5 | 3,172 | 79.3 |
| 3 or higher | 140 | 3.5 | 3,733 | 93.3 |
| 2 or higher | 455 | 11.4 | 3,939 | 98.5 |
| 1 or higher | 1,449 | 36.2 | 3,994 | 99.9 |
| 0 or higher | 4,000 | 100.0 | 4,000 | 100.0 |
| M (SD) | 0.5 (0.9) | 4.8 (1.6) | ||
| Cohen’s d | 3.36 | |||
Note. An IncX score of 3 is used to indicate a potentially inconsistent response style. Positive Cohen's d values represent higher means in the random sample. Guidelines for evaluating |d| are .20 = small, .50 = medium, .80 = large.
For all tables in this section, the “rater” refers to the person completing the assessment, and the “ratee” refers to the person being rated.
Table A.35. Demographic Description of EQ 360 2.0 Pilot Data (Ratees)
The following table summarizes the demographic characteristics of the person being rated (i.e., ratees) in the EQ 360 2.0 pilot data sample. Ideally, this sample should include representation from a wide range of demographic groups, as found in the EQ 360 2.0 pilot data.
Demographic |
N | % | |
|---|---|---|---|
Ratee Gender |
Male | 299 | 39.4 |
| Female | 449 | 59.2 | |
| Missing | 11 | 1.4 | |
Ratee Age Group (Years) |
18–29 | 167 | 22.0 |
| 30–39 | 245 | 32.3 | |
| 40–49 | 145 | 19.1 | |
| 50–59 | 134 | 17.7 | |
| 60+ | 68 | 9.0 | |
Ratee Race/Ethnicity |
Black | 54 | 7.1 |
| Hispanic/Latino | 42 | 5.5 | |
| White | 564 | 74.3 | |
| Other | 99 | 13.0 | |
Total |
759 | 100.0 | |
Table A.36. Comparison of EQ 360 2.0 Scores in U.S. and Canadian Samples
The following table provides mean and standard deviations of EQ 360 2.0 scores in U.S. and Canadian samples. d values provide an effect size to describe differences between the two countries as small, medium, or large. F and p values provide statistical significance tests for these differences. The lack of meaningful differences (i.e., |d| ≥ .20) found between U.S. and Canadian participants supports combining the two countries in the EQ 360 2.0 normative sample.
Scale |
U.S. | Canada | Cohen’s d | F | p | |
|---|---|---|---|---|---|---|
Total EI |
M | 100.2 | 97.8 | 0.16 | 6.60 | .010 |
| SD | 15.0 | 15.0 | ||||
Self-Perception Composite |
M | 100.1 | 98.8 | 0.09 | 1.89 | .169 |
| SD | 15.0 | 15.0 | ||||
Self-Regard |
M | 100.2 | 98.2 | 0.13 | 4.19 | .041 |
| SD | 15.0 | 15.0 | ||||
Self-Actualization |
M | 100.1 | 98.9 | 0.08 | 1.52 | .217 |
| SD | 15.0 | 15.0 | ||||
Emotional Self-Awareness |
M | 100.0 | 99.8 | 0.01 | 0.05 | .822 |
| SD | 15.0 | 15.0 | ||||
Self-Expression Composite |
M | 100.2 | 97.5 | 0.18 | 8.27 | .004 |
| SD | 15.0 | 15.0 | ||||
Emotional Expression |
M | 100.3 | 97.0 | 0.22 | 11.71 | .001 |
| SD | 14.8 | 14.9 | ||||
Assertiveness |
M | 100.1 | 99.2 | 0.06 | 0.75 | .386 |
| SD | 15.0 | 15.0 | ||||
Independence |
M | 100.2 | 97.9 | 0.16 | 6.03 | .014 |
| SD | 14.9 | 14.9 | ||||
Interpersonal Composite |
M | 100.1 | 98.5 | 0.11 | 3.12 | .077 |
| SD | 15.0 | 15.0 | ||||
Interpersonal Relationships |
M | 100.1 | 98.6 | 0.10 | 2.59 | .107 |
| SD | 15.0 | 15.0 | ||||
Empathy |
M | 100.2 | 98.3 | 0.12 | 3.69 | .055 |
| SD | 14.9 | 15.0 | ||||
Social Responsibility |
M | 100.1 | 99.0 | 0.08 | 1.40 | .237 |
| SD | 14.9 | 15.0 | ||||
Decision Making Composite |
M | 100.3 | 97.0 | 0.22 | 12.03 | .001 |
| SD | 15.0 | 15.0 | ||||
Problem Solving |
M | 100.3 | 96.9 | 0.23 | 12.72 | .000 |
| SD | 14.9 | 15.0 | ||||
Reality Testing |
M | 100.1 | 98.6 | 0.10 | 2.59 | .108 |
| SD | 15.0 | 15.0 | ||||
Impulse Control |
M | 100.3 | 96.7 | 0.24 | 14.48 | < .001 |
| SD | 15.0 | 15.0 | ||||
Stress Management Composite |
M | 100.2 | 98.0 | 0.15 | 5.46 | .019 |
| SD | 15.0 | 15.0 | ||||
Flexibility |
M | 100.2 | 97.6 | 0.18 | 7.71 | .006 |
| SD | 14.9 | 15.0 | ||||
Stress Tolerance |
M | 100.1 | 98.5 | 0.11 | 2.87 | .090 |
| SD | 14.9 | 15.0 | ||||
Optimism |
M | 100.1 | 98.4 | 0.12 | 3.45 | .063 |
| SD | 15.0 | 15.0 | ||||
Happiness |
M | 100.1 | 99.0 | 0.07 | 1.24 | .265 |
| SD | 15.0 | 15.0 | ||||
Note. Positive Cohen's d values signify higher means in the U.S. group, negative Cohen’s d values signify higher means in the Canadian group. Sample sizes vary due to missing data: U.S. = 2,925 to 2,928, Canada = 272. df for F-tests = 1, 3195 (Total EI); 1, 3194 (composites); 1, 3192 (subscales). Guidelines for evaluating |d| are .20 = small, .50 = medium, .80 = large.
Table A.37. Length of Rater/Ratee Relationship: EQ 360 2.0 Normative Sample
The following table describes the raters in the EQ 360 2.0 normative sample in terms of the length of their relationship with the ratee. Ideally, the majority of raters should have a long (at least one year) relationship with ratees to ensure ratings are well-informed, as found in over 90% of the EQ 360 2.0 normative sample.
Length of Relationship to Ratee |
N | % |
|---|---|---|
| Less than 3 Months | 0 | 0.0 |
| 3 Months to Under 1 Year | 308 | 9.6 |
| 1 to 5 Years | 1,285 | 40.2 |
| 6 to 10 Years | 522 | 16.3 |
| Over 10 Years | 1,085 | 33.9 |
| Total | 3,200 | 100.0 |
Table A.38. Strength of Rater/Ratee Relationship: EQ 360 2.0 Normative Sample
The following table describes the raters in the EQ 360 2.0 normative sample in terms of the strength of their relationship with the ratee. Ideally, the majority of raters should have a strong (at least “Fairly Well”) relationship with ratees to ensure ratings are well-informed, as found in the EQ 360 2.0 normative sample.
How Well Rater Knows Ratee |
N | % |
|---|---|---|
| Not Very Well | 0 | 0.0 |
| Fairly Well | 1,346 | 42.1 |
| Well | 793 | 24.8 |
| Very Well | 1,061 | 33.2 |
| Total | 3,200 | 100.0 |
Table A.39. Distribution of Rater Types by Gender: EQ 360 2.0 Normative Sample
The following table describes the ratee gender distribution of the EQ 360 2.0 normative sample within rater types. Ideally, males and females should show similar proportions within rater types to ensure equal representation, as found in the EQ 360 2.0 normative sample.
Rater Type |
Ratee Gender | ||
|---|---|---|---|
| Male | Female | Total | |
| Direct Report | 400 | 400 | 800 |
| Manager | 400 | 400 | 800 |
| Work Peer | 400 | 400 | 800 |
| Family/Friend | 400 | 400 | 800 |
| Total | 1,600 | 1,600 | 3,200 |
Table A.40. Ratee Age Group by Gender Distribution: EQ 360 2.0 Normative Sample
The following table describes the gender distribution of the EQ 360 2.0 normative sample within age groups. Ideally, as found in the EQ 360 2.0 normative sample, the groups should show similar proportions, reflecting equal representation of all gender x age groups.
Ratee Age Group (Years) |
Ratee Gender | |||||
|---|---|---|---|---|---|---|
| Male | Female | Total | ||||
| N | % | N | % | N | % | |
| 18–24 | 118 | 3.7 | 124 | 3.9 | 242 | 7.6 |
| 25–29 | 185 | 5.8 | 190 | 5.9 | 375 | 11.7 |
| 30–34 | 185 | 5.8 | 186 | 5.8 | 371 | 11.6 |
| 35–39 | 191 | 6.0 | 189 | 5.9 | 380 | 11.9 |
| 40–44 | 191 | 6.0 | 189 | 5.9 | 380 | 11.9 |
| 45–49 | 188 | 5.9 | 178 | 5.6 | 366 | 11.4 |
| 50–54 | 183 | 5.7 | 189 | 5.9 | 372 | 11.6 |
| 55–59 | 181 | 5.7 | 182 | 5.7 | 363 | 11.3 |
| 60+ | 178 | 5.5 | 173 | 5.4 | 351 | 10.9 |
| Total | 1,600 | 50.0 | 1,600 | 50.0 | 3,200 | 100.0 |
Table A.41. Distribution of Ratee Race/Ethnicity by Rater Type: EQ 360 2.0 Normative Sample
The following table summarizes the racial/ethnic distribution of the EQ 360 2.0 normative sample along with Census information. Ideally, the normative sample should show race/ethnicity proportions similar to Census. Note that separate Census targets are provided for Direct Report rater types (i.e., the ratee is a manager) because racial/ethnic representation for managers is slightly different from the general population. All race/ethnic groups were within 4% of Census, suggesting the normative sample is representative of the general population.
Country |
Ratee Race/Ethnicity |
Rater Type | |||||
|---|---|---|---|---|---|---|---|
| Direct Report | Other Rater Types (Manager, Work Peer, Family/Friend) |
||||||
| N | % | Census % | N | % | Census % | ||
U.S. |
Other | 50 | 6.8 | 6.7 | 156 | 7.1 | 6.7 |
| Black | 60 | 8.1 | 8.3 | 269 | 12.3 | 12.2 | |
| Hispanic/Latino | 45 | 6.1 | 7.0 | 274 | 12.5 | 15.0 | |
| White | 585 | 79.1 | 78.0 | 1489 | 68.1 | 66.1 | |
| Total | 740 | 100.0 | 100.0 | 2188 | 100.0 | 100.0 | |
Canada |
White | 47 | 78.3 | 80.0 | 177 | 83.5 | 80.0 |
| Non-White | 13 | 21.7 | 20.0 | 35 | 16.5 | 20.0 | |
| Total | 60 | 100.0 | 100.0 | 212 | 100.0 | 100.0 | |
Table A.42. Ratee Geographic Region Distribution: EQ 360 2.0 Normative Sample
The following table summarizes the geographic region distribution of the EQ 360 2.0 normative sample along with Census information. Ideally, the normative sample should show region proportions similar to Census. These results were found for most of the regional groups in the EQ 360 2.0 normative sample, suggesting it is representative of the general population.
Country |
Ratee Geographic Region |
N | % | Census % |
|---|---|---|---|---|
U.S. |
Northeast | 515 | 16.1 | 18.1 |
| Midwest | 646 | 20.2 | 21.9 | |
| South | 1,063 | 33.2 | 36.7 | |
| West | 704 | 22.0 | 23.3 | |
| Total | 2,928 | 100.0 | 100.0 | |
Canada |
West | 29 | 10.7 | 13.0 |
| Prairies | 31 | 11.4 | 17.1 | |
| Central | 200 | 73.5 | 62.4 | |
| East | 12 | 4.4 | 7.3 | |
| Total | 272 | 100.0 | 100.0 |
Table A.43. Multivariate Effects of Ratee Age, Gender, and Rater Type on EQ 360 2.0 Scores
The following table summarizes the results from the multivariate analyses of covariance (MANCOVAs) conducted on the composite scales and subscales to examine potential effects of gender, age, and rater type, or their respective interactions on EQ 360 2.0 scores in the normative sample. Wilks’ lambda ranges from 0.00 to 1.00 and depicts the amount of variance not explained by the demographic variable. F and p values convey the statistical significance of the demographic variables. Partial η2 values provide an effect size for describing the effects as small, medium, or large. Meaningful effect sizes (i.e., partial η2 ≥ .01) suggest differences among participants based on the demographic variable. Because the interaction effects were not significant at the multivariate level, the univaritate effects of the interactions were not explored.
Analysis |
Demographic Variable |
Wilks' Lambda | F (df) | p | Partial η2 |
|---|---|---|---|---|---|
Composites |
Gender | .969 | 20.12 (5, 3166) | < .001 | .03 |
| Age | .970 | 4.87 (20, 10501.38) | < .001 | .01 | |
| Rater Type | .932 | 15.17 (15, 8740.33) | < .001 | .02 | |
| Gender x Age | .992 | 1.26 (20, 10501.38) | .197 | .00 | |
| Gender x Rater Type | .996 | 0.76 (15, 8740.33) | .726 | .00 | |
| Age x Rater Type | .974 | 1.41 (60, 14828.92) | .021 | .01 | |
Subscales |
Gender | .909 | 19.76 (16, 3153) | < .001 | .09 |
| Age | .912 | 4.57(64, 12345.71) | < .001 | .02 | |
| Rater Type | .843 | 11.52 (48, 9455) | < .001 | .06 | |
| Gender x Age | .980 | 1.01 (64, 12345.71) | .450 | .01 | |
| Gender x Rater Type | .927 | 0.97 (48, 9378.60) | .537 | .01 | |
| Age x Rater Type | .927 | 1.26 (192, 30483.87) | .009 | .01 |
Table A.44. Effect Sizes for Gender, Age, and Rater Type Effects in the EQ 360 2.0 Normative Sample
The following table summarizes the effect sizes for the effects of gender, age, and the rater type on the EQ 360 2.0 Total EI score, composite scales and subscales in the normative sample. Meaningful effect sizes (i.e., |d| ≥ .20; partial η2 ≥ .01) suggest differences among participants (ratees) based on the demographic variable, and that separate demographic norm groups may be required. The d and partial η2 values found in the EQ 360 2.0 normative sample suggest negligible or very small effects of ratee gender, ratee age, and rater type.
Scale |
Ratee Gender (Cohen’s d) | Ratee Age (partial η2) | Rater Type (partial η2) |
|---|---|---|---|
Total EI |
-0.01 | .00 | .00 |
Self-Perception Composite |
-0.02 | .00 | .00 |
|
-0.11 | .00 | .01 |
|
-0.02 | .00 | .01 |
|
-0.15 | .00 | .01 |
Self-Expression Composite |
-0.05 | .00 | .02 |
|
-0.29 | .00 | .00 |
|
0.04 | .00 | .02 |
|
0.13 | .01 | .04 |
Interpersonal Composite |
-0.12 | .00 | .01 |
|
-0.01 | .00 | .01 |
|
-0.19 | .00 | .01 |
|
-0.11 | .01 | .00 |
Decision Making Composite |
0.06 | .00 | .01 |
|
0.14 | .00 | .02 |
|
0.02 | .00 | .01 |
|
0.01 | .01 | .01 |
Stress Management Composite |
0.08 | .00 | .01 |
|
0.04 | .01 | .01 |
|
0.16 | .00 | .01 |
|
0.01 | .00 | .00 |
Happiness |
0.03 | .00 | .00 |
Note. N = 3,200. Positive Cohen’s d values represent higher scores in males, negative Cohen’s d values represent higher scores in females. Guidelines for evaluating |d| are .20 = small, .50 = medium, .80 = large. Guidelines for evaluating partial η2 are .01 = small, .06 = medium, .14 = large.
Table A.45. Ratee Gender Differences in EQ 360 2.0 Scores
The following table provides means and standard deviations for the EQ 360 2.0 Total EI score, composite scales, and subscales for ratings of male and female ratees in the EQ 360 2.0 normative sample. F and p values convey the statistical significance of gender differences. p values less than .01, which were found for a few EQ 360 2.0 scales, suggest differences between male and female ratees.
Scale |
Ratee Gender | F | p | ||
|---|---|---|---|---|---|
| Male | Female | ||||
Total EI |
M |
99.8 | 99.8 | 0.01 | .936 |
SD |
15.6 | 15.6 | |||
Self-Perception Composite |
M |
99.8 | 99.9 | 0.05 | .818 |
SD |
15.6 | 15.7 | |||
Self-Regard |
M |
101.0 | 99.1 | 11.98 | .001 |
SD |
15.6 | 15.6 | |||
Self Actualization |
M |
99.8 | 99.9 | 0.02 | .885 |
SD |
15.6 | 15.6 | |||
Emotional Self-Awareness |
M |
98.6 | 101.0 | 18.65 | < .001 |
SD |
15.6 | 15.6 | |||
Self-Expression Composite |
M |
99.6 | 100.2 | 1.21 | .271 |
SD |
15.5 | 15.5 | |||
Emotional Expression |
M |
97.7 | 101.9 | 60.03 | < .001 |
SD |
15.5 | 15.5 | |||
Assertiveness |
M |
100.3 | 99.6 | 1.66 | .198 |
SD |
15.5 | 15.5 | |||
Independence |
M |
100.9 | 98.9 | 14.27 | < .001 |
SD |
15.2 | 15.2 | |||
Interpersonal Composite |
M |
99.0 | 100.7 | 10.20 | .001 |
SD |
15.6 | 15.6 | |||
Interpersonal Relationships |
M |
99.9 | 99.9 | 0.00 | .995 |
SD |
15.6 | 15.6 | |||
Empathy |
M |
98.4 | 101.3 | 27.97 | < .001 |
SD |
15.5 | 15.5 | |||
Social Responsibility |
M |
99.1 | 100.8 | 8.97 | .003 |
SD |
15.6 | 15.6 | |||
Decision Making Composite |
M |
100.3 | 99.4 | 2.90 | .088 |
SD |
15.6 | 15.6 | |||
Problem Solving |
M |
100.9 | 98.9 | 13.82 | < .001 |
SD |
15.4 | 15.4 | |||
Reality Testing |
M |
100.0 | 99.7 | 0.37 | .541 |
SD |
15.6 | 15.6 | |||
Impulse Control |
M |
100.0 | 99.8 | 0.06 | .811 |
SD |
15.6 | 15.6 | |||
Stress Management Composite |
M |
100.4 | 99.0 | 5.78 | .016 |
SD |
15.6 | 15.6 | |||
Flexibility |
M |
99.9 | 99.3 | 1.04 | .307 |
SD |
15.5 | 15.5 | |||
Stress Tolerance |
M |
101.1 | 98.5 | 22.99 | < .001 |
SD |
15.5 | 15.5 | |||
Optimism |
M |
100.0 | 99.7 | 0.34 | .559 |
SD |
15.6 | 15.7 | |||
Happiness |
M |
100.2 | 99.6 | 1.11 | .291 |
SD |
15.7 | 15.7 | |||
Note. Sample sizes vary due to missing data: Males, N = 1,598–1,600; females, N = 1,599–1,600. df for F-tests = 1, 3190 (Total EI); 1, 3189 (composites); 1, 3187 (subscales). Positive d values represent higher mean scores in males, negative d values represent higher mean scores in females. Guidelines for evaluating |d| = .20 (small); .50 (medium); .80 (large).
Table A.46. Ratee Age Differences in EQ 360 2.0 Scores
The following table provides means and standard deviations for the EQ 360 2.0 Total EI score, composite scales, and subscales for the various rate age groups in the EQ 360 2.0 normative sample. F and p values convey the statistical significance of age differences. p values less than .01, which were found for a few EQ 360 2.0 scales, suggest a difference in scores among EQ 360 2.0 ratee age groups.
Scale |
Ratee Age | F | p | |||||
|---|---|---|---|---|---|---|---|---|
| 18–29 Years | 30–39 Years | 40–49 Years | 50–59 Years | 60+ Years | ||||
Total EI |
M | 98.9 | 100.8 | 100.4 | 100.4 | 98.5 | 2.39 | .048 |
| SD | 15.2 | 14.9 | 15.0 | 15.0 | 15.0 | |||
Self-Perception Composite |
M | 99.0 | 100.8 | 100.4 | 100.1 | 99.1 | 1.70 | .148 |
| SD | 15.2 | 15.0 | 15.0 | 15.0 | 15.0 | |||
Self-Regard |
M | 99.0 | 100.3 | 100.1 | 100.1 | 100.6 | 0.84 | .500 |
| SD | 15.1 | 14.9 | 14.9 | 14.9 | 15.0 | |||
Self Actualization |
M | 98.9 | 100.9 | 100.5 | 100.2 | 98.6 | 2.44 | .045 |
| SD | 15.1 | 14.9 | 14.9 | 14.9 | 15.0 | |||
Emotional Self-Awareness |
M | 99.5 | 100.7 | 100.4 | 100.1 | 98.3 | 1.84 | .118 |
| SD | 15.1 | 14.9 | 14.9 | 14.9 | 15.0 | |||
Self-Expression Composite |
M | 98.6 | 100.3 | 100.9 | 100.6 | 98.9 | 2.89 | .021 |
| SD | 15.0 | 14.8 | 14.8 | 14.8 | 14.9 | |||
Emotional Expression |
M | 100.4 | 100.3 | 100.5 | 99.7 | 98.2 | 1.72 | .143 |
| SD | 15.1 | 14.8 | 14.8 | 14.9 | 14.9 | |||
Assertiveness |
M | 98.9 | 99.8 | 100.7 | 100.6 | 99.8 | 1.59 | .175 |
| SD | 15.1 | 14.8 | 14.8 | 14.9 | 14.9 | |||
Independence |
M | 97.5 | 100.6 | 100.9 | 101.0 | 99.4 | 6.64 | < .001 |
| SD | 14.8 | 14.5 | 14.5 | 14.6 | 14.6 | |||
Interpersonal Composite |
M | 99.0 | 100.8 | 99.9 | 100.4 | 99.2 | 1.68 | .153 |
| SD | 15.1 | 14.9 | 14.9 | 14.9 | 15.0 | |||
Interpersonal Relationships |
M | 100.4 | 100.6 | 99.7 | 99.8 | 98.8 | 1.17 | .324 |
| SD | 15.2 | 14.9 | 14.9 | 15.0 | 15.0 | |||
Empathy |
M | 99.0 | 100.9 | 100.2 | 100.1 | 99.1 | 1.66 | .156 |
| SD | 15.1 | 14.9 | 14.9 | 14.9 | 14.9 | |||
Social Responsibility |
M | 97.4 | 100.6 | 99.8 | 101.6 | 100.2 | 6.98 | < .001 |
| SD | 15.1 | 14.9 | 14.9 | 14.9 | 15.0 | |||
Decision Making Composite |
M | 98.4 | 100.6 | 100.5 | 100.8 | 98.8 | 3.37 | .009 |
| SD | 15.1 | 14.9 | 14.9 | 14.9 | 15.0 | |||
Problem Solving |
M | 98.5 | 100.6 | 100.6 | 100.5 | 99.3 | 2.54 | .038 |
| SD | 15.0 | 14.8 | 14.8 | 14.8 | 14.8 | |||
Reality Testing |
M | 99.2 | 100.8 | 100.4 | 100.3 | 98.4 | 2.12 | .076 |
| SD | 15.2 | 14.9 | 14.9 | 15.0 | 15.0 | |||
Impulse Control |
M | 98.3 | 100.2 | 100.4 | 101.3 | 99.3 | 3.91 | .004 |
| SD | 15.1 | 14.9 | 14.9 | 14.9 | 15.0 | |||
Stress Management Composite |
M | 100.1 | 101.0 | 100.3 | 99.7 | 97.4 | 3.69 | .005 |
| SD | 15.1 | 14.9 | 14.9 | 14.9 | 15.0 | |||
Flexibility |
M | 101.3 | 101.2 | 100.4 | 98.9 | 96.3 | 8.97 | < .001 |
| SD | 15.1 | 14.8 | 14.9 | 14.9 | 14.9 | |||
Stress Tolerance |
M | 99.0 | 100.9 | 100.5 | 100.4 | 98.0 | 3.33 | .010 |
| SD | 15.0 | 14.8 | 14.8 | 14.8 | 14.9 | |||
Optimism |
M | 100.1 | 100.5 | 100.0 | 99.8 | 98.6 | 0.99 | .414 |
| SD | 15.2 | 15.0 | 15.0 | 15.0 | 15.0 | |||
Happiness |
M | 100.6 | 100.6 | 99.7 | 99.6 | 99.0 | 1.04 | .385 |
| SD | 15.2 | 15.0 | 15.0 | 15.0 | 15.1 | |||
Note. Sample sizes vary due to missing data: 18–29 Years, N = 616–617; 30–39 Years, N = 750–751; 40–49 Years, N = 746; 50–59 Years, N = 746; 60+ Years, N = 350–351. df for F-tests = 4, 3190 (Total EI); 4, 3189 (composites); 4, 3187 (subscales).
Table A.47. Rater Type Differences in EQ 360 2.0 Scores
The following table provides means and standard deviations for the EQ 360 2.0 Total EI score, composite scales, and subscales for the various rater types in the EQ 360 2.0 normative sample. F and p values convey the statistical significance of rater type differences.
Scale |
Rater Type | F | p | ||||
|---|---|---|---|---|---|---|---|
| Direct Report | Manager | Work Peer | Friend/Family Member | ||||
Total EI |
M | 101.4 | 98.2 | 99.5 | 100.2 | 5.63 | .001 |
| SD | 15.8 | 15.8 | 15.6 | 15.5 | |||
Self-Perception Composite |
M | 101.4 | 98.5 | 99.4 | 100.2 | 4.89 | .002 |
| SD | 15.8 | 15.8 | 15.6 | 15.5 | |||
Self-Regard |
M | 102.4 | 98.6 | 100.2 | 98.9 | 9.85 | < .001 |
| SD | 15.8 | 15.8 | 15.6 | 15.5 | |||
Self Actualization |
M | 101.7 | 98.6 | 99.0 | 100.0 | 6.25 | < .001 |
| SD | 15.8 | 15.8 | 15.6 | 15.5 | |||
Emotional Self-Awareness |
M | 99.1 | 98.9 | 99.3 | 102.0 | 7.38 | < .001 |
| SD | 15.7 | 15.8 | 15.5 | 15.4 | |||
Self-Expression Composite |
M | 103.0 | 97.1 | 99.5 | 99.9 | 18.78 | < .001 |
| SD | 15.7 | 15.7 | 15.5 | 15.3 | |||
Emotional Expression |
M | 99.5 | 99.9 | 100.9 | 98.9 | 2.24 | .082 |
| SD | 15.7 | 15.7 | 15.5 | 15.4 | |||
Assertiveness |
M | 102.9 | 97.8 | 98.7 | 100.5 | 16.46 | < .001 |
| SD | 15.7 | 15.7 | 15.5 | 15.4 | |||
Independence |
M | 104.5 | 95.6 | 99.1 | 100.3 | 44.86 | < .001 |
| SD | 15.4 | 15.4 | 15.2 | 15.1 | |||
Interpersonal Composite |
M | 98.6 | 99.4 | 99.8 | 101.8 | 6.12 | < .001 |
| SD | 15.8 | 15.8 | 15.6 | 15.4 | |||
Interpersonal Relationships |
M | 98.4 | 99.0 | 99.9 | 102.2 | 9.45 | < .001 |
| SD | 15.8 | 15.8 | 15.6 | 15.5 | |||
Empathy |
M | 98.4 | 99.4 | 99.6 | 102.0 | 8.05 | < .001 |
| SD | 15.7 | 15.7 | 15.5 | 15.4 | |||
Social Responsibility |
M | 99.6 | 100.1 | 99.9 | 100.2 | 0.27 | .847 |
| SD | 15.8 | 15.8 | 15.6 | 15.5 | |||
Decision Making Composite |
M | 101.8 | 98.4 | 99.9 | 99.2 | 7.08 | < .001 |
| SD | 15.8 | 15.8 | 15.6 | 15.4 | |||
Problem Solving |
M | 103.2 | 97.4 | 100.4 | 98.5 | 21.79 | < .001 |
| SD | 15.6 | 15.6 | 15.4 | 15.3 | |||
Reality Testing |
M | 99.8 | 98.7 | 99.1 | 101.7 | 5.75 | .001 |
| SD | 15.8 | 15.8 | 15.6 | 15.5 | |||
Impulse Control |
M | 101.7 | 99.8 | 100.3 | 97.8 | 8.41 | < .001 |
| SD | 15.8 | 15.8 | 15.6 | 15.4 | |||
Stress Management Composite |
M | 102.0 | 98.1 | 99.2 | 99.5 | 8.80 | < .001 |
| SD | 15.8 | 15.8 | 15.6 | 15.4 | |||
Flexibility |
M | 102.2 | 98.5 | 99.9 | 97.8 | 12.48 | < .001 |
| SD | 15.7 | 15.7 | 15.5 | 15.4 | |||
Stress Tolerance |
M | 102.2 | 97.8 | 99.3 | 99.8 | 10.79 | < .001 |
| SD | 15.7 | 15.7 | 15.5 | 15.4 | |||
Optimism |
M | 100.9 | 98.7 | 98.8 | 100.8 | 4.83 | .002 |
| SD | 15.8 | 15.8 | 15.6 | 15.5 | |||
Happiness |
M | 100.7 | 98.7 | 99.9 | 100.2 | 2.34 | .072 |
| SD | 15.9 | 15.9 | 15.6 | 15.5 | |||
Note. Sample sizes vary due to missing data: Direct Report, N = 798–800; Manager, N = 799–800; Work Peer, N = 800; Family/Friend, N = 800. df for F-tests = 3, 3190 (Total EI); 3, 3189 (composites); 3, 3187 (subscales).
Figure A.2. Histogram of EQ 360 2.0 Total EI Standard Score in the Normative Sample
The following figure illustrates the distribution of EQ 360 2.0 Total EI scores in the normative sample. Distributions that approximate a normal (“bell-shaped”) curve, such as in the figure below, suggest it is unnecessary to apply a normalizing transformation to EQ 360 2.0 scores.
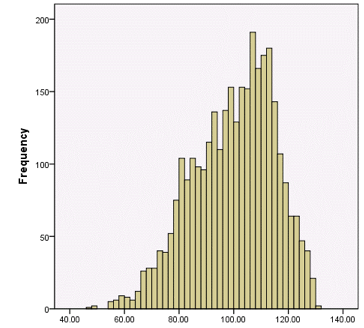
EQ 360 2.0 Total EI Standard Score
Table A.48. Internal Consistency: EQ 360 2.0 Normative Sample
The following table summarizes the internal consistency (Cronbach’s alpha) values for the EQ 360 2.0 Total EI score, composite scales, and subscales in the EQ 360 2.0 normative sample. Alpha values range from 0.00 to 1.00. Higher values, as found in the EQ 360 2.0 normative sample, support the excellent reliability of the EQ 360 2.0.
Scale |
# of items | EQ 360 2.0 Normative Sample |
|---|---|---|
Total EI |
118 | .98 |
Self-Perception Composite |
24 | .94 |
Self-Regard |
8 | .87 |
Self-Actualization |
9 | .92 |
Emotional Self-Awareness |
7 | .86 |
Self-Expression Composite |
23 | .89 |
Emotional Expression |
8 | .82 |
Assertiveness |
7 | .79 |
Independence |
8 | .85 |
Interpersonal Composite |
23 | .96 |
Interpersonal Relationships |
7 | .92 |
Empathy |
9 | .94 |
Social Responsibility |
6 | .87 |
Decision Making Composite |
24 | .94 |
Problem Solving |
8 | .90 |
Reality Testing |
9 | .89 |
Impulse Control |
8 | .86 |
Stress Management Composite |
24 | .95 |
Flexibility |
8 | .86 |
Stress Tolerance |
8 | .90 |
Optimism |
8 | .92 |
Well-Being Indicator |
8 | .92 |
Note. N = 3,200.
Table A.49. Demographic Characteristics of EQ 360 2.0 Test-Retest Sample
The following table summarizes the demographic characteristics of the EQ 360 2.0 test-retest sample. Ideally, this sample should include representation from a wide range of demographic groups, as found in the EQ 360 2.0 test-retest sample.
Demographic |
N | % | |
|---|---|---|---|
Ratee Gender |
Male | 100 | 49.3 |
| Female | 103 | 50.7 | |
Ratee Race/Ethnicity |
Black | 45 | 22.2 |
| Hispanic/Latino | 30 | 14.8 | |
| White | 112 | 55.2 | |
| Other | 16 | 7.9 | |
Ratee Age Group (Years) |
18–29 | 52 | 25.6 |
| 30–39 | 48 | 23.6 | |
| 40–49 | 45 | 22.2 | |
| 50–59 | 43 | 21.2 | |
| 60+ | 15 | 7.4 | |
Ratee U.S. Geographic Region |
Northeast | 29 | 14.3 |
| Midwest | 39 | 19.2 | |
| South | 84 | 41.4 | |
| West | 50 | 24.6 | |
Rater Type |
Direct report | 23 | 11.3 |
| Manager | 51 | 25.1 | |
| Work Peer | 96 | 47.3 | |
| Friend/Family Member | 33 | 16.3 | |
Total |
203 | 100.0 | |
Note. All demographic variables represent ratees except Rater Type. Mean and standard deviation for age was unavailable. Region value for one participant was Canada. Time interval mean = 19.3 days (SD = 2.4 days), range = 14–23 days.
Table A.50. EQ 360 2.0 Test-Retest Correlations and Descriptive Statistics
The following table displays the test-retest correlations, as well as time 1 and time 2 means and standard deviations for the EQ 360 2.0 Total EI score, composite scales, and subscales. Correlations range from 0.00 to 1.00. Higher values, as found in the EQ 360 2.0, suggest very good test-retest reliability.
Scale |
Test-retest r | Time 1 | Time 2 | ||
|---|---|---|---|---|---|
| M | SD | M | SD | ||
Total EI |
.89 | 98.4 | 14.9 | 98.2 | 16.0 |
Self-Perception Composite |
.83 | 98.3 | 14.8 | 98.9 | 16.1 |
Self-Regard |
.82 | 98.5 | 14.7 | 99.0 | 15.5 |
Self-Actualization |
.81 | 98.2 | 14.8 | 98.6 | 16.0 |
Emotional Self-Awareness |
.78 | 98.8 | 15.0 | 99.4 | 16.0 |
Self-Expression Composite |
.84 | 98.2 | 14.6 | 98.0 | 15.8 |
Emotional Expression |
.79 | 99.6 | 14.2 | 99.2 | 13.9 |
Assertiveness |
.76 | 98.8 | 14.8 | 98.6 | 15.2 |
Independence |
.84 | 97.5 | 15.7 | 97.4 | 16.9 |
Interpersonal Composite |
.89 | 98.2 | 15.2 | 98.3 | 15.6 |
Interpersonal Relationships |
.89 | 98.3 | 15.9 | 98.0 | 16.1 |
Empathy |
.86 | 98.3 | 15.4 | 98.2 | 15.5 |
Social Responsibility |
.84 | 98.5 | 14.5 | 99.4 | 15.1 |
Decision Making Composite |
.86 | 98.9 | 14.5 | 98.1 | 15.8 |
Problem Solving |
.82 | 98.8 | 15.4 | 98.1 | 16.3 |
Reality Testing |
.83 | 98.7 | 14.5 | 98.7 | 15.4 |
Impulse Control |
.78 | 99.7 | 14.0 | 98.4 | 15.4 |
Stress Management Composite |
.89 | 98.8 | 15.3 | 98.4 | 16.3 |
Flexibility |
.81 | 99.5 | 15.5 | 98.3 | 15.9 |
Stress Tolerance |
.85 | 99.3 | 14.9 | 98.4 | 15.9 |
Optimism |
.85 | 98.1 | 15.5 | 98.9 | 15.9 |
Happiness |
.87 | 98.4 | 15.0 | 98.7 | 15.8 |
Note. N = 203.
Table A.51. Differences between Time 1 and Time 2 EQ 360 2.0 Standard Scores
The following table summarizes the differences between time 1 and time 2 scores for the EQ 360 2.0 Total EI score, composite scales, and subscales. The first set of results (% of Respondents) lists the percentage of respondents whose scores decreased by more than 15 points, changed by 15 points or less, or increased by more than 15 points over time. Test-retest stability is supported if the majority of respondents show changes of 15 points or less over time, as found in the EQ 360 2.0. The mean and standard deviation of these differences across participants is also provided, along with the 95% confidence interval (CI), which illustrates whether the difference is statistically meaningful for the sample as a whole. That is, if the CI includes zero between the lower bound (LB) and upper bound (UB), as found for the majority of EQ 360 2.0 scales, the difference is not statistically meaningful.
Scale |
% of Respondents | M Diff |
SD | 95% CI | |||
|---|---|---|---|---|---|---|---|
| Scores Decreased More than 1 SD (15 Points) |
Scores Changed by 1 SD or Less (15 Points) |
Scores Increased More than 1 SD (15 Points) |
LB | UB | |||
Total EI |
3.4 | 95.1 | 1.5 | -0.2 | 7.4 | -0.9 | 0.6 |
Self-Perception Composite |
3.4 | 92.1 | 4.4 | 0.6 | 9.1 | -0.3 | 1.6 |
Self-Regard |
2.5 | 92.2 | 5.4 | 0.5 | 9.2 | -0.5 | 1.6 |
Self-Actualization |
2.5 | 94.5 | 3.0 | 0.4 | 9.6 | -0.7 | 1.4 |
Emotional Self-Awareness |
3.0 | 90.6 | 6.4 | 0.8 | 10.4 | -0.1 | 1.7 |
Self-Expression Composite |
3.9 | 93.6 | 2.5 | -0.3 | 8.6 | -1.1 | 0.6 |
Emotional Expression |
4.4 | 90.2 | 5.4 | -0.4 | 9.2 | -1.3 | 0.6 |
Assertiveness |
7.9 | 85.3 | 6.9 | -0.2 | 10.5 | -1.1 | 0.7 |
Independence |
3.9 | 93.6 | 2.5 | -0.1 | 9.2 | -1.0 | 0.9 |
Interpersonal Composite |
3.0 | 95.6 | 1.5 | 0.1 | 7.3 | -0.6 | 0.8 |
Interpersonal Relationships |
2.0 | 96.1 | 2.0 | -0.3 | 7.4 | -1.2 | 0.5 |
Empathy |
3.0 | 94.5 | 2.5 | -0.1 | 8.1 | -0.9 | 0.7 |
Social Responsibility |
1.5 | 95.1 | 3.4 | 1.0 | 8.5 | 0.2 | 1.7 |
Decision Making Composite |
4.9 | 94.1 | 1.0 | -0.8 | 8.2 | -1.6 | 0.0 |
Problem Solving |
4.9 | 91.7 | 3.4 | -0.7 | 9.6 | -1.7 | 0.3 |
Reality Testing |
3.4 | 94.6 | 2.0 | 0.0 | 8.9 | -1.0 | 1.0 |
Impulse Control |
6.9 | 90.1 | 3.0 | -1.4 | 9.7 | -2.2 | -0.5 |
Stress Management Composite |
3.9 | 95.1 | 1.0 | -0.5 | 7.6 | -1.2 | 0.3 |
Flexibility |
5.9 | 89.7 | 4.4 | -1.2 | 9.7 | -2.2 | -0.3 |
Stress Tolerance |
5.4 | 92.6 | 2.0 | -0.9 | 8.4 | -1.7 | 0.0 |
Optimism |
4.9 | 93.6 | 1.5 | 0.8 | 8.5 | -0.0 | 1.7 |
Happiness |
3.4 | 93.6 | 3.0 | 0.3 | 8.0 | -0.6 | 1.1 |
Note. N = 203. M Diff = mean difference; CI = confidence interval; LB = lower bound, UB = upper bound.
Table A.52. Correlations among EQ 360 2.0 Composite Scales (Normative Sample)
The following table illustrates the correlations among the EQ 360 2.0 composite scales in the EQ 360 2.0 normative sample. Correlations range from 0.00 to 1.00, with higher values suggesting the scales share a relevant common psychological characteristic (i.e., emotional intelligence). Moderately sized correlations, like those that were found in the EQ 360 2.0, support both the concept that the scales measure a common psychological characteristic, as well as the multidimensional factor structure of the EQ 360 2.0.
Composite Scale |
SP | SE | IS | DM | SM |
|---|---|---|---|---|---|
| SP. Self-Perception Composite | – | ||||
| SE. Self-Expression Composite | .79 | – | |||
| IS. Interpersonal Composite | .81 | .64 | – | ||
| DM. Decision Making Composite | .80 | .74 | .74 | – | |
| SM. Stress Management Composite | .85 | .75 | .80 | .86 | – |
Note. N = 3,200. All correlations significant at p < .01. Guidelines for evaluating r are .10 = small, .30 = medium, .50 = large.
Table A.53. Correlations among EQ 360 2.0 Subscales (Normative Sample)
The following table illustrates the correlations among the EQ 360 2.0 subscales in the EQ 360 2.0 normative sample. Correlations range from 0.00 to 1.00, with higher values suggesting the scales share a relevant common psychological characteristic (i.e., emotional intelligence). Shaded cells portray correlations of subscales within their respective composite scales. Moderate correlations support the multidimensional factor structure of the EQ 360 2.0.
Scale |
Self-Perception | Self-Expression | Interpersonal | Decision Making | Stress Management | HA | ||||||||||
|---|---|---|---|---|---|---|---|---|---|---|---|---|---|---|---|---|
| SR | SA | ES | EE | AS | IN | IR | EM | RE | PS | RT | IC | FL | ST | OP | ||
SR. Self-Regard |
– | |||||||||||||||
SA. Self-Actualization |
.72 | – | ||||||||||||||
ES. Emotional Self-Awareness |
.54 | .67 | – | |||||||||||||
EE. Emotional Expression |
.51 | .49 | .56 | – | ||||||||||||
AS. Assertiveness |
.58 | .62 | .53 | .41 | – | |||||||||||
IN. Independence |
.64 | .63 | .40 | .37 | .60 | – | ||||||||||
IR. Interpersonal Relationships |
.59 | .71 | .67 | .61 | .45 | .43 | – | |||||||||
EM. Empathy |
.49 | .68 | .76 | .59 | .40 | .37 | .81 | – | ||||||||
RE. Social Responsibility |
.56 | .76 | .65 | .50 | .48 | .43 | .71 | .75 | – | |||||||
PS. Problem Solving |
.68 | .68 | .50 | .48 | .54 | .80 | .55 | .53 | .53 | – | ||||||
RT. Reality Testing |
.64 | .79 | .82 | .52 | .60 | .56 | .74 | .80 | .72 | .66 | – | |||||
IC. Impulse Control |
.43 | .49 | .42 | .31 | .23 | .50 | .45 | .54 | .47 | .67 | .55 | – | ||||
FL. Flexibility |
.57 | .58 | .51 | .57 | .35 | .60 | .61 | .59 | .53 | .74 | .61 | .60 | – | |||
ST. Stress Tolerance |
.70 | .78 | .63 | .46 | .59 | .69 | .66 | .64 | .63 | .80 | .78 | .60 | .69 | – | ||
OP. Optimism |
.72 | .78 | .66 | .54 | .47 | .50 | .77 | .74 | .71 | .64 | .74 | .50 | .63 | .75 | – | |
HA. Happiness |
.80 | .76 | .62 | .59 | .48 | .52 | .77 | .68 | .67 | .63 | .71 | .48 | .63 | .71 | .87 | – |
Note. N = 3,200. All correlations significant at p < .01. Cutoffs for evaluating r are .10 = small, .30 = medium, .50 = large. Shaded cells represent subscale groupings within composite scales.
Table A.54. Demographic Distribution of Self-Other Agreement Sample
The following table summarizes the demographic characteristics of the EQ 360 2.0 self-other agreement sample. Ideally, this sample should include representation from a wide range of demographic groups, as found in the EQ 360 2.0 self-other agreement sample.
Demographic |
N | % | |
|---|---|---|---|
Ratee Gender |
Male | 52 | 48.1 |
| Female | 56 | 51.9 | |
Ratee Race/Ethnicity |
Black | 4 | 3.7 |
| Hispanic/Latino | 26 | 24.1 | |
| White | 77 | 71.3 | |
| Other | 1 | 0.9 | |
Ratee Age Group (Years) |
18–29 | 19 | 17.6 |
| 30–39 | 43 | 39.8 | |
| 40–49 | 29 | 26.9 | |
| 50–59 | 14 | 13.0 | |
| 60+ | 3 | 2.8 | |
| M (SD) | 38.9 (10.3) | ||
Ratee U.S. Geographic Region |
Northeast | 35 | 32.4 |
| Midwest | 11 | 10.2 | |
| South | 62 | 57.4 | |
| West | 0 | 0.0 | |
Ratee Education Level |
High school or less | 19 | 17.6 |
| Some college | 27 | 25.0 | |
| College or higher | 62 | 57.4 | |
Total |
108 | 100.0 | |
Table A.55. Self-Other Agreement Correlations between the EQ-i 2.0 and EQ 360 2.0
The following table summarizes the self (EQ-i 2.0) – other (EQ 360 2.0) agreement correlations for the Total EI score, composite scales, and subscales. Correlations range from 0.00 to 1.00, with higher values suggesting higher levels of self-other agreement. Moderate correlations, like those found in this study, provide support for the validity of the EQ 360 2.0. That is, small correlations would indicate a lack of self-other agreement, and very high correlations would indicate redundancy in capturing both self and other ratings. The moderately sized correlations support the validity of the EQ 360 2.0 and provide support for collecting both self and rater reports.
Scale |
Self-Other Agreement (r) | EQ-i 2.0 | EQ 360 2.0 | ||
|---|---|---|---|---|---|
| M | SD | M | SD | ||
Total EI |
.60 | 102.7 | 15.4 | 103.9 | 14.3 |
Self-Perception Composite |
.57 | 104.7 | 15.0 | 105.6 | 17.1 |
Self-Regard |
.61 | 101.7 | 15.3 | 99.9 | 18.4 |
Self-Actualization |
.51 | 105.9 | 13.3 | 106.1 | 14.8 |
Emotional Self-Awareness |
.52 | 105.0 | 15.4 | 108.7 | 16.7 |
Self-Expression Composite |
.66 | 101.4 | 16.3 | 102.3 | 15.0 |
Emotional Expression |
.50 | 101.5 | 15.4 | 99.9 | 17.5 |
Assertiveness |
.56 | 102.9 | 16.9 | 104.2 | 14.9 |
Independence |
.59 | 99.0 | 17.0 | 101.7 | 14.1 |
Interpersonal Composite |
.65 | 105.3 | 15.8 | 106.4 | 14.3 |
Interpersonal Relationships |
.55 | 103.7 | 15.3 | 104.6 | 13.5 |
Empathy |
.65 | 104.5 | 15.6 | 107.3 | 15.0 |
Social Responsibility |
.59 | 105.6 | 15.0 | 105.3 | 14.7 |
Decision Making Composite |
.54 | 101.2 | 16.9 | 103.2 | 13.4 |
Problem Solving |
.55 | 97.8 | 16.7 | 99.5 | 12.6 |
Reality Testing |
.52 | 106.1 | 15.4 | 108.9 | 15.0 |
Impulse Control |
.52 | 99.6 | 16.9 | 100.1 | 14.4 |
Stress Management Composite |
.52 | 98.8 | 13.9 | 100.0 | 13.0 |
Flexibility |
.49 | 93.5 | 15.3 | 94.0 | 15.1 |
Stress Tolerance |
.44 | 99.6 | 15.5 | 101.2 | 13.1 |
Optimism |
.70 | 103.3 | 13.5 | 104.2 | 15.1 |
Happiness |
.72 | 102.6 | 13.1 | 102.2 | 16.0 |
Note. N = 108. All correlations significant at p < .01. Guidelines for evaluating r are .10 = small, .30 = medium, .50 = large.
Table A.56. Comparison of EQ-i 2.0 and EQ 360 2.0 Standard Scores
The following table summarizes the differences between self (EQ-i 2.0) and other (EQ 360 2.0) scores for the EQ-i 2.0/EQ 360 2.0 Total EI score, composite scales, and subscales. This table lists the percentage of respondents who showed EQ 360 2.0 scores that were higher than their EQ-i 2.0 scores by more than 10 points, scores that differed by 10 points or less, and those whose EQ-i 2.0 scores were higher than their EQ 360 2.0 scores by more than 10 points. Self-other agreement (or self-other consistency) is supported if many respondents show differences of 10 points or less, as found in the EQ 360 2.0 self-other agreement sample.
Scale |
% of Respondents | ||
|---|---|---|---|
| EQ 360 2.0 Scores Higher by > 10 Points |
Scores Differ by 10 Points or Less |
EQ 360 2.0 Scores Higher by > 10 Points |
|
Total EI |
23.1 | 59.3 | 17.6 |
Self-Perception Composite |
21.3 | 61.1 | 17.6 |
Self-Regard |
16.7 | 61.1 | 22.2 |
Self-Actualization |
21.3 | 62.0 | 16.7 |
Emotional Self-Awareness |
32.4 | 50.9 | 16.7 |
Self-Expression Composite |
19.4 | 63.9 | 16.7 |
Emotional Expression |
27.8 | 58.3 | 13.9 |
Assertiveness |
22.2 | 60.2 | 17.6 |
Independence |
27.8 | 53.7 | 18.5 |
Interpersonal Composite |
25.0 | 61.1 | 13.9 |
Interpersonal Relationships |
21.3 | 63.9 | 14.8 |
Empathy |
27.8 | 58.3 | 13.9 |
Social Responsibility |
20.4 | 56.5 | 23.1 |
Decision Making Composite |
30.6 | 50.0 | 19.4 |
Problem Solving |
27.8 | 53.7 | 18.5 |
Reality Testing |
28.7 | 53.7 | 17.6 |
Impulse Control |
25.9 | 50.0 | 24.1 |
Stress Management Composite |
26.9 | 57.4 | 15.7 |
Flexibility |
23.1 | 56.5 | 20.4 |
Stress Tolerance |
28.7 | 54.6 | 16.7 |
Optimism |
14.8 | 68.5 | 16.7 |
Happiness |
15.7 | 67.6 | 16.7 |
Table A.57. Demographic Characteristics of SAS-SR Validity Sample
The following table summarizes the demographic characteristics of the Social Adjustment Scale–Self-Report (SAS-SR ; Weissman, 1999) validity sample. Ideally, this sample should include representation from a wide range of demographic groups, as found in the SAS-SR validity sample.
Demographic |
N | % | |
|---|---|---|---|
Ratee Gender |
Male | 52 | 48.1 |
| Female | 56 | 51.9 | |
Ratee Age Group (Years) |
18–29 | 19 | 17.6 |
| 30–39 | 43 | 39.8 | |
| 40–49 | 29 | 26.9 | |
| 50–59 | 14 | 13.0 | |
| 60+ | 3 | 2.8 | |
| M (SD) | 38.9 (10.3) | ||
Ratee Race/Ethnicity |
Black | 4 | 3.7 |
| Hispanic/Latino | 26 | 24.1 | |
| White | 77 | 71.3 | |
| Other | 1 | 0.9 | |
Ratee Education Level |
High School or Less | 19 | 17.6 |
| Some College/University | 27 | 25.0 | |
| College/University or Higher | 62 | 57.4 | |
Ratee U.S. Geographic Region |
Northeast | 35 | 32.4 |
| Midwest | 11 | 10.2 | |
| South | 62 | 57.4 | |
| West | 0 | 0.0 | |
Total |
108 | 100.0 | |
Table A.58. Multiple Regression Results for EQ-i 2.0 and EQ 360 2.0 Predicting Social Adjustment Scale–Self-Report Total Scores
The following table summarizes the extent to which the EQ-i 2.0 and EQ 360 2.0 are independently related to Social Adjustment Scale–Self-Report (SAS–SR) scores. Significant (p < .05) beta (β) values demonstrate independent associations with SAS–SR scores. Significant (p < .05) ƒ2 values, as found for the EQ 360 2.0 Total EI score and many composite scales and subscales suggest the EQ 360 2.0 provides added value over the EQ-i 2.0 in relation to SAS–SR scores.
Scale |
R | Step 1 | Step 2 | R2 | R2 change | ƒ2 | ||||||
|---|---|---|---|---|---|---|---|---|---|---|---|---|
| EQ-i 2.0 | EQ-i 2.0 | EQ 360 2.0 | Step 1 | Step 2 | ||||||||
| EQ-i 2.0 | EQ 360 2.0 | β | p | β | p | β | p | |||||
Total EI |
-.45 | -.42 | -0.45 | < .01 | -0.31 | .01 | -0.23 | .03 | .20 | .24 | .03 | .04 |
Self-Perception Composite |
-.45 | -.43 | -0.45 | < .01 | -0.30 | .01 | -0.26 | .01 | .20 | .25 | .05 | .06 |
Self-Regard |
-.50 | -.46 | -0.50 | < .01 | -0.35 | < .01 | -0.25 | .02 | .25 | .29 | .04 | .05 |
Self-Actualization |
-.38 | -.39 | -0.38 | < .01 | -0.24 | .02 | -0.27 | .01 | .14 | .19 | .05 | .06 |
Emotional Self-Awareness |
-.25 | -.33 | -0.25 | .01 | -0.11 | .30 | -0.27 | .01 | .06 | .12 | .05 | .06 |
Self-Expression Composite |
-.51 | -.39 | -0.51 | < .01 | -0.44 | < .01 | -0.10 | .35 | .26 | .26 | .01 | .01 |
Emotional Expression |
-.41 | -.29 | -0.41 | < .01 | -0.35 | < .01 | -0.11 | .27 | .17 | .18 | .01 | .01 |
Assertiveness |
-.34 | -.30 | -0.34 | < .01 | -0.26 | .02 | -0.15 | .17 | .12 | .13 | .02 | .02 |
Independence |
-.41 | -.33 | -0.41 | < .01 | -0.34 | < .01 | -0.13 | .23 | .17 | .18 | .01 | .01 |
Interpersonal Composite |
-.27 | -.38 | -0.27 | < .01 | -0.04 | .71 | -0.35 | < .01 | .07 | .15 | .07 | .09 |
Interpersonal Relationships |
-.30 | -.37 | -0.30 | < .01 | -0.14 | .20 | -0.29 | .01 | .09 | .15 | .06 | .07 |
Empathy |
-.18 | -.36 | -0.18 | .06 | 0.10 | .41 | -0.43 | < .01 | .03 | .14 | .11 | .12 |
Social Responsibility |
-.24 | -.30 | -0.24 | .01 | -0.11 | .36 | -0.23 | .04 | .06 | .10 | .04 | .04 |
Decision Making Composite |
-.38 | -.35 | -0.38 | < .01 | -0.26 | .01 | -0.21 | .05 | .14 | .17 | .03 | .04 |
Problem Solving |
-.42 | -.37 | -0.42 | < .01 | -0.32 | < .01 | -0.19 | .07 | .18 | .21 | .03 | .03 |
Reality Testing |
-.21 | -.37 | -0.21 | .03 | -0.02 | .84 | -0.36 | < .01 | .04 | .14 | .09 | .11 |
Impulse Control |
-.26 | -.15 | -0.26 | .01 | -0.26 | .02 | -0.02 | .89 | .07 | .07 | .00 | .00 |
Stress Management Composite |
-.31 | -.31 | -0.31 | < .01 | -0.20 | .06 | -0.21 | .06 | .10 | .13 | .03 | .04 |
Flexibility |
-.08 | -.11 | -0.08 | .42 | -0.03 | .76 | -0.09 | .42 | .01 | .01 | .01 | .01 |
Stress Tolerance |
-.25 | -.29 | -0.25 | .01 | -0.15 | .15 | -0.22 | .04 | .06 | .10 | .04 | .04 |
Optimism |
-.40 | -.35 | -0.40 | < .01 | 0.29 | .02 | -0.15 | .23 | .16 | .17 | .01 | .01 |
Happiness |
-.56 | -.43 | -0.56 | < .01 | -0.51 | < .01 | -0.07 | .57 | .31 | .31 | .00 | .00 |
Note. N = 108. Correlations of .19 and above are significant at p < .05, correlations of .25 and above are significant at p < .01. Guidelines for evaluating r are .10 = small, .30 = medium, .50 = large. Guidelines for evaluating f2 are .02 = small, .15 = medium, .35 = large.
Table A.59. Interaction Effects between Rater Race/Ethnicity and Ratee Race/Ethnicity: EQ 360 2.0 Normative Sample
The following table summarizes the results from the analysis of covariance (ANCOVA) and multivariate analyses of covariance (MANCOVAs) conducted on the composite scales and subscales to examine potential effects of ratee race, rater race, and the interaction between the two on EQ 360 2.0 scores in the normative sample. Wilks’ lambda ranges from 0.00 to 1.00 and depicts the amount of variance not explained by the demographic variable. F and p values convey the statistical significance of the demographic variables. Partial η2 values provide an effect size for describing the effects as small, medium, or large. The effect sizes found (all less than .06) suggest negligible differences among participants based on rater and ratee race.
Analysis |
Effect |
Wilks’ Lambda | F (df) | p | partial η2 |
|---|---|---|---|---|---|
Total EI |
Rater Race (White vs. non-White) | n/a | 0.10 (1, 2948) |
.757 | .00 |
| Ratee Race (Black vs. Hispanic/Latino vs. White) | n/a | 1.95 (2, 2948) |
.143 | .00 | |
| Rater Race x Ratee Race | n/a | 2.41 (2, 2948) |
.090 | .00 | |
Composite Scales |
Rater Race (White vs. non-White) | .994 | 3.46 (5, 2944) |
.004 | .01 |
| Ratee Race (Black vs. Hispanic/Latino vs. White) | .995 | 1.43 (10, 5888) |
.160 | .00 | |
| Rater Race x Ratee Race | .995 | 1.48 (10, 5888) |
.141 | .00 | |
Subscales |
Rater Race (White vs. non-White) | .980 | 3.72 (16, 2931) |
< .001 | .02 |
| Ratee Race (Black vs. Hispanic/Latino vs. White) | .980 | 1.89 (32, 5862) |
.002 | .01 | |
| Rater Race x Ratee Race | .982 | 1.68 (32, 5862) |
.010 | .01 |
Note. N = 2,956. F-test values represent univariate effects for the Total EI score and multivariate effects for the composite scales and subscales. Guidelines for evaluating partial η2 are .01 = small; .06 = medium; .14 = large. n/a = not applicable.