Appendix A: Standardization, Reliability, and Validity Tables
Figure A.1. Histogram of EQ-i 2.0 Total EI Standard Scores in the Normative Sample
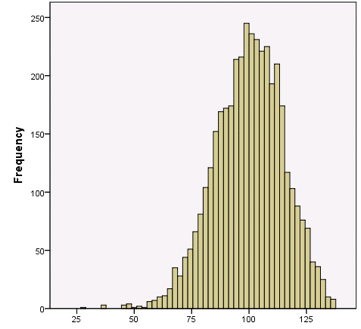
The following figure illustrates the distribution of EQ-i 2.0 Total EI scores in the normative sample. Distributions that approximate a normal (“bell-shaped”) curve, such as those found in the figure below, suggest it is unnecessary to apply a normalizing transformation to EQ-i 2.0 scores.