Appendix A: Standardization, Reliability, and Validity Tables
Figure A.2. Histogram of EQ 360 2.0 Total EI Standard Score in the Normative Sample
The following figure illustrates the distribution of EQ 360 2.0 Total EI scores in the normative sample. Distributions that approximate a normal (“bell-shaped”) curve, such as in the figure below, suggest it is unnecessary to apply a normalizing transformation to EQ 360 2.0 scores.
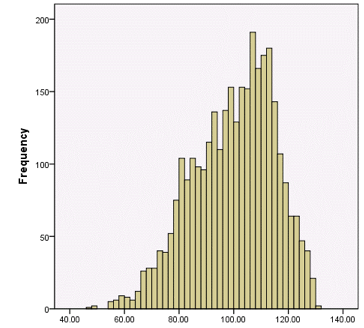
EQ 360 2.0 Total EI Standard Score