


Appendix G: EQ-i® 2.0 Higher Education Norms
This appendix presents the statistical results pertaining to the development of the EQ-i 2.0 Higher Education Norms. Please see Higher Education Norms for full interpretive text.
- Table G.1. Year of Study × Gender Distribution of the EQ-i 2.0 Higher Education Normative Sample
- Table G.2. Program of Study and Program Type Distribution of the EQ-i 2.0 Higher Education Normative Sample
- Table G.3. Geographic Region Distribution of the EQ-i 2.0 Higher Education Normative Sample
- Table G.4. Race/Ethnicity Distribution of the EQ-i 2.0 Higher Education Normative Sample
- Table G.5. Effect Sizes for Gender and Year of Study Effects in the EQ-i 2.0 Higher Education Normative Sample
- Table G.6. Gender Differences in the EQ-i 2.0 Higher Education Normative Sample
- Table G.7. Year of Study Effects in the EQ-i 2.0 Higher Education Normative Sample
- Figure G.1. Histogram of EQ-i 2.0 Total EI Standard Scores in the Higher Education Normative Sample
- Table G.8. Higher Education Normative Sample Scored with General Population Norms
- Table G.9. Internal Consistency of EQ-i 2.0 Scales in the Higher Education Normative Sample
- Table G.10. Test-Retest Correlations and Descriptive Statistics in the EQ-i 2.0 Higher Education Sample
- Table G.11. Test-Retest Stability in the EQ-i 2.0 Higher Education Sample
- Table G.12. Correlations Among EQ-i 2.0 Composite Scales in the Higher Education Normative Sample
- Table G.13. Correlations Among EQ-i 2.0 Subscales in the Higher Education Normative Sample
- Table G.14. Relationship Between EQ-i 2.0 Scores and GPA in the Higher Education Normative Sample
- Table G.15. Effect Sizes for GPA Group Differences in the EQ-i 2.0 Higher Education Normative Sample
- Table G.16. Program of Study Group Differences in the EQ-i 2.0 Higher Education Normative Sample
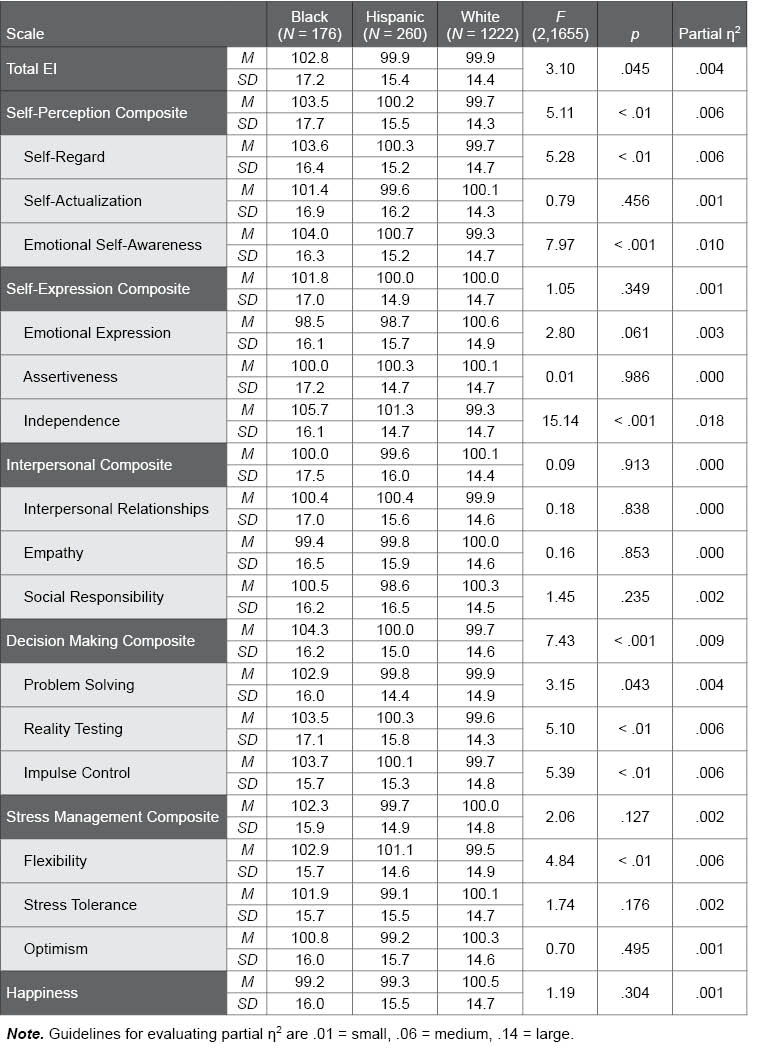
- Table G.17. Race/Ethnicity Group Differences in the EQ-i 2.0 Higher Education Normative Sample
Table G.1. Year of Study × Gender Distribution of the EQ-i 2.0 Higher Education Normative Sample
The following table presents the distribution of the EQ-i 2.0 Higher Education normative sample, categorized by year of study and gender. An equal number of men and women were sampled at each year of study.
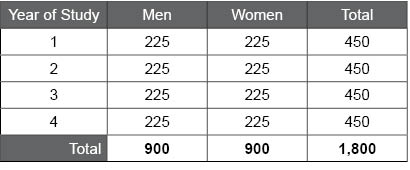
Table G.2. Program of Study and Program Type Distribution of the EQ-i 2.0 Higher Education Normative Sample
The following table presents the distribution of the EQ-i 2.0 Higher Education normative sample by program of study and program type.
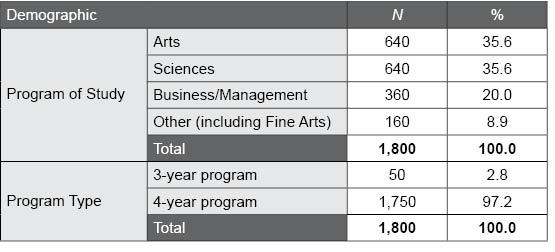
Table G.3. Geographic Region Distribution of the EQ-i 2.0 Higher Education Normative Sample
The following table summarizes the geographic region distribution of the EQ-i 2.0 normative sample along with U.S. and Canadian Census information (Statistics Canada, 2006; U.S. Bureau of the Census, 2010). The regional distribution of the EQ-i 2.0 normative sample is similar to the Census.
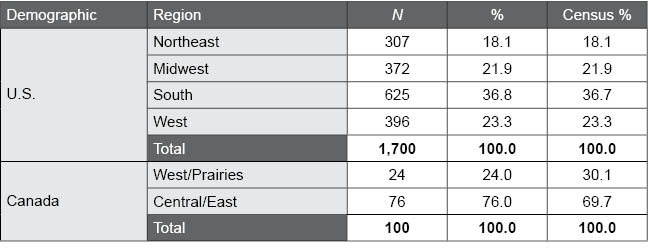
Table G.4. Race/Ethnicity Distribution of the EQ-i 2.0 Higher Education Normative Sample
The following table presents the race/ethnicity distribution for the EQ-i 2.0 Higher Education normative sample along with U.S. and Canadian Census information for adults (Statistics Canada, 2006; U.S. Bureau of the Census, 2010). The EQ-i 2.0 normative sample showed percentages within 5% for each racial/ethnic group (most within 2.0%), suggesting it is very similar to the Census.
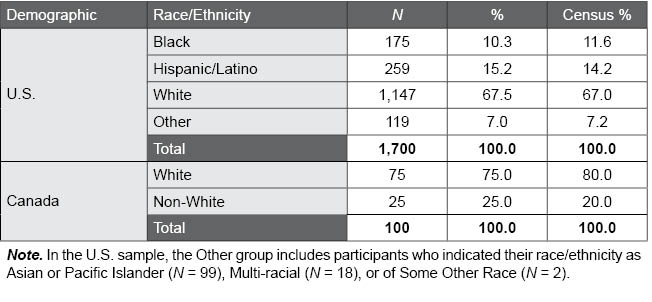
Table G.5. Effect Sizes for Gender and Year of Study Effects in the EQ-i 2.0 Higher Education Normative Sample
The following table summarizes the effect sizes for the effects of gender, year of study, and the interaction between gender and year of study on the EQ-i 2.0 Total EI score, composite scales, and subscales in the Higher Education normative sample. Meaningful effect sizes (i.e., |d| ≥ 0.20, partial η2 ≥ .01) suggest differences among participants based on the demographic variable, and that separate demographic norm groups may be required.
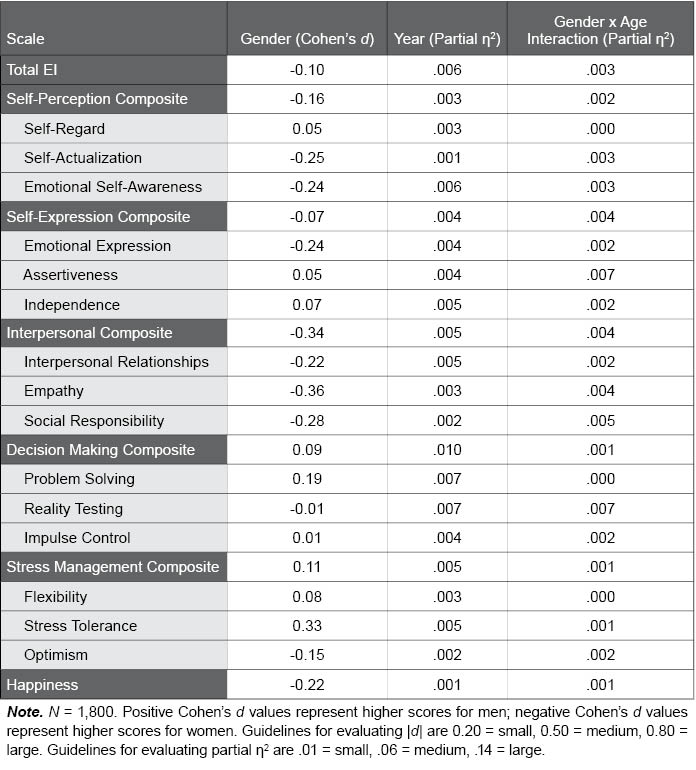
Table G.6. Gender Differences in the EQ-i 2.0 Higher Education Normative Sample
The following table provides EQ-i 2.0 standard score scale means and standard deviations for men and women in the Higher Education normative sample. F and p values convey the statistical significance of gender differences; p values lower than .01, which were found for many scales, indicate significant differences between men and women.
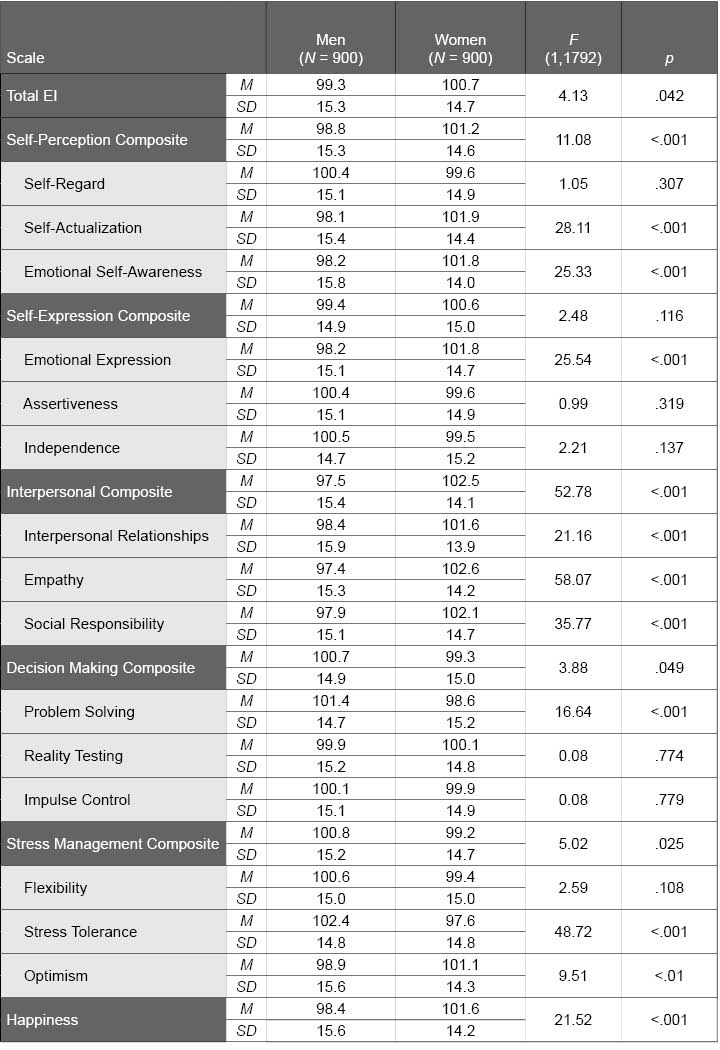
Table G.7. Year of Study Effects in the EQ-i 2.0 Higher Education Normative Sample
The following table provides EQ-i 2.0 standard score scale means and standard deviations for each Year of Study group in the Higher Education normative sample. F and p values convey the statistical significance of Year of Study group differences; p values lower than .01, which were found for only a few scales, suggest significant differences among the groups.
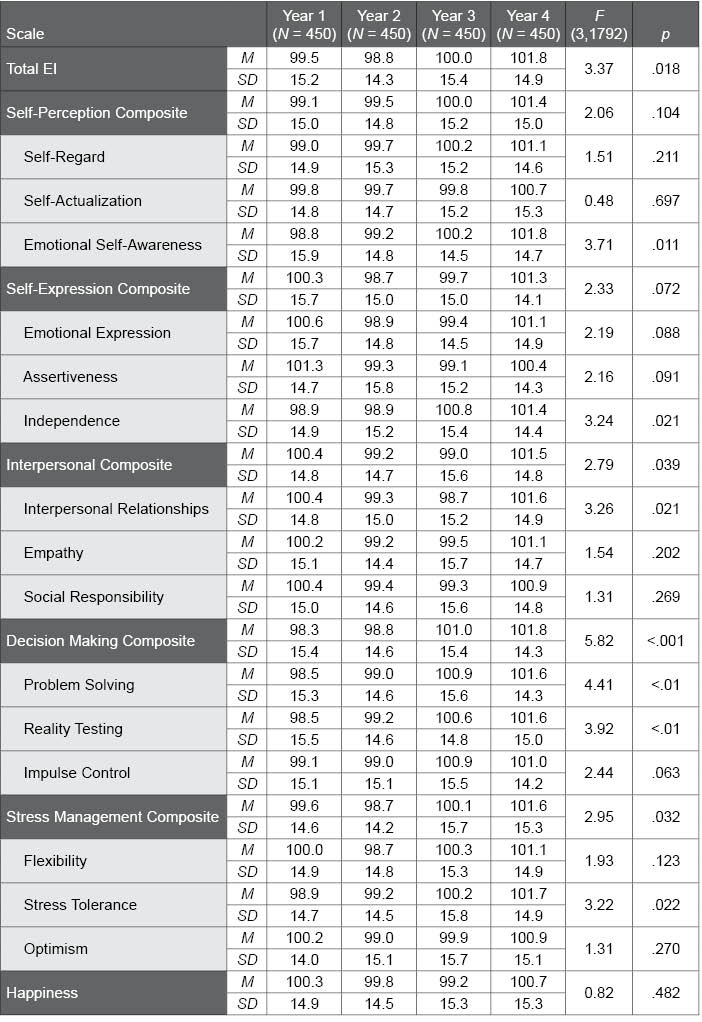
Figure G.1. Histogram of EQ-i 2.0 Total EI Standard Scores in the Higher Education Normative Sample
This figure illustrates the distribution of EQ-i 2.0 Total EI standard scores in the Higher Education normative sample. The distribution of the actual scores closely approximates the normal “bell-shaped” curve (shown using the black curved line), which suggests that it is unnecessary to apply a normalizing transformation to the scores. Distributions for most other composite scales and subscales show a similar pattern, some with a slight negative skew.
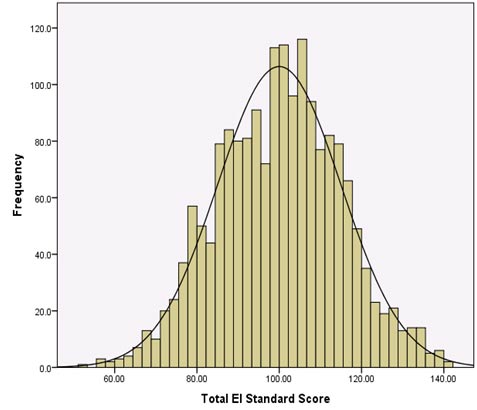
Table G.8. Higher Education Normative Sample Scored with General Population Norms
The following table provides EQ-i 2.0 standard score scale means and standard deviations for the Higher Education normative sample when scored with the North American General Population norms, and compared against a mean of 100. Cohen’s d values provide an effect size to describe differences between the samples as small, medium, or large; t and p values provide statistical significance tests for these differences.
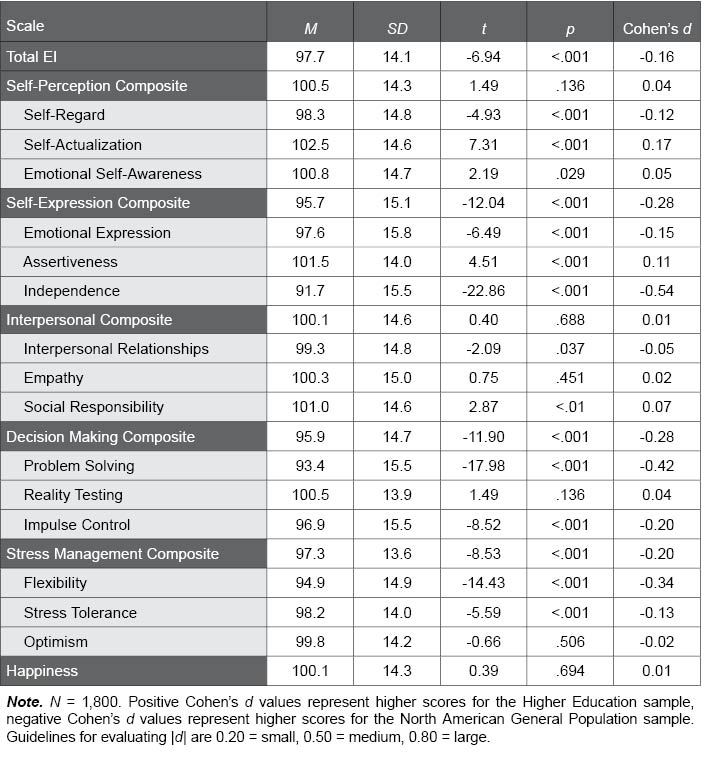
Table G.9. Internal Consistency of EQ-i 2.0 Scales in the Higher Education Normative Sample
The following table presents internal consistency (Cronbach’s alpha) values for the EQ-i 2.0 scales in the Higher Education normative sample. Overall values are presented, as well as those separated by gender. Values range from 0.00 to 1.00. Higher values, like those found in the Higher Education normative sample, provide evidence for strong reliability.
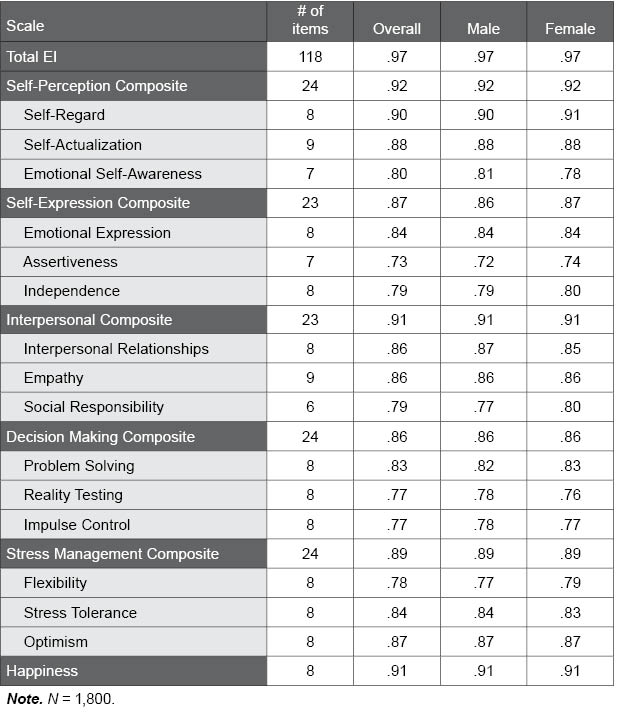
Table G.10. Test-Retest Correlations and Descriptive Statistics in the EQ-i 2.0 Higher Education Sample
The following table presents test-retest correlations and the Time 1 and Time 2 means and standard deviations for the EQ-i 2.0 scales in the Higher Education test-retest sample. Note that these correlations have been corrected for range-restriction. Correlations range from 0.00 to 1.00. Higher values, as found in the EQ-i 2.0 test-retest sample, suggest excellent test-retest reliability.
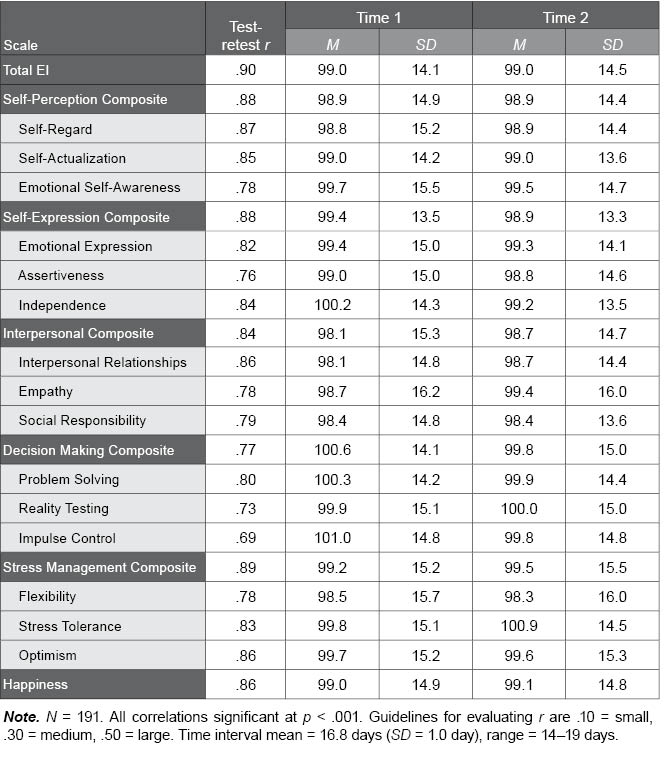
Table G.11. Test-Retest Stability in the EQ-i 2.0 Higher Education Sample
The following table presents stability information for the EQ-i 2.0 Higher Education test-retest sample. The first set of results lists the percentage of respondents whose scores decreased by more than 15 points, changed by 15 points or less, or increased by more than 15 points over time. Test-retest stability is supported if the majority of respondents show changes of 15 points or less over time, as found in the EQ-i 2.0 Higher Education test-retest sample. The mean and standard deviation of these differences across participants is also provided, along with the 95% confidence interval, which illustrates whether the difference is statistically meaningful for the sample as a whole. That is, if the confidence interval includes zero between the lower bound (LB) and upper bound (UB), the difference is not statistically meaningful, as was found for all of the EQ-i 2.0 scales and subscales.
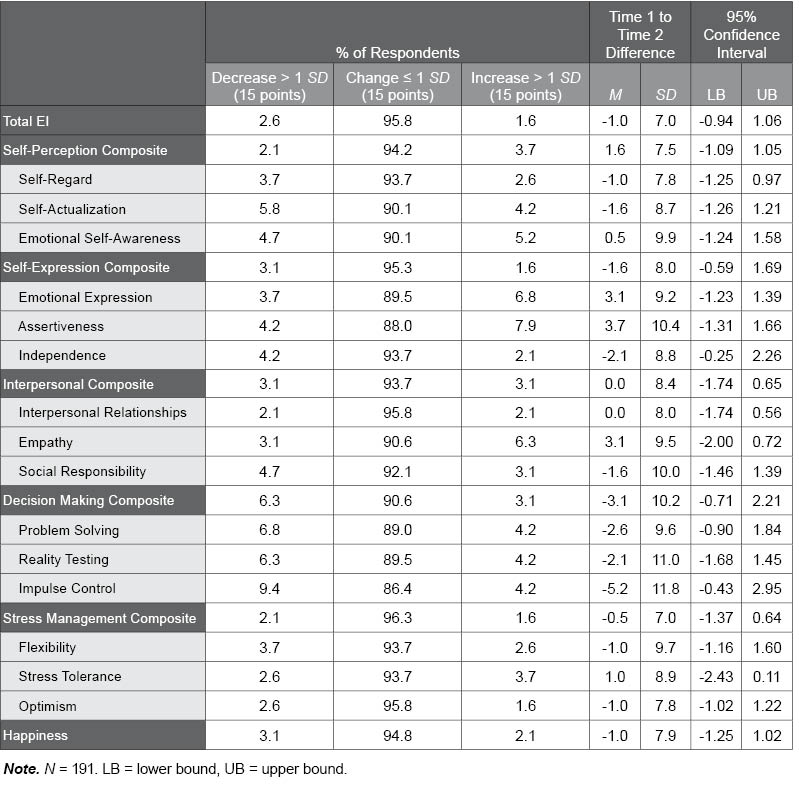
Table G.12. Correlations Among EQ-i 2.0 Composite Scales in the Higher Education Normative Sample
The following table illustrates the correlations among the EQ-i 2.0 composite scales in the Higher Education normative sample. Correlations range from 0.00 to 1.00, with higher values suggesting the scales are interrelated and measure a common construct (i.e., emotional intelligence). Very high values (e.g., > .90) would suggest a unidimensional factor structure. Moderate to large-sized correlations, like those found in the Higher Education normative sample, support both the concept that the scales measure an underlying common construct, as well as the multidimensional factor structure of the EQ-i 2.0.
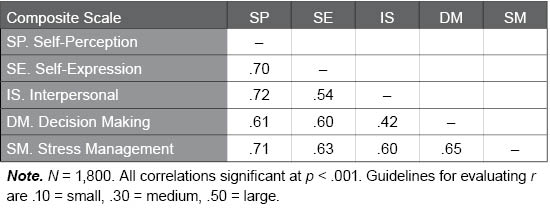
Table G.13. Correlations Among EQ-i 2.0 Subscales in the Higher Education Normative Sample
The following table illustrates the correlations among the EQ-i 2.0 subscales in the Higher Education normative sample. Correlations range from 0.00 to 1.00; higher values suggest the scales share a relevant common psychological characteristic. Shaded cells indicate correlations between subscales within the same composite scale. Moderate to large correlations were found within the composite scales, supporting both the concept that the scales measure a common psychological characteristic, as well as the multidimensional factor structure of the EQ-i 2.0.
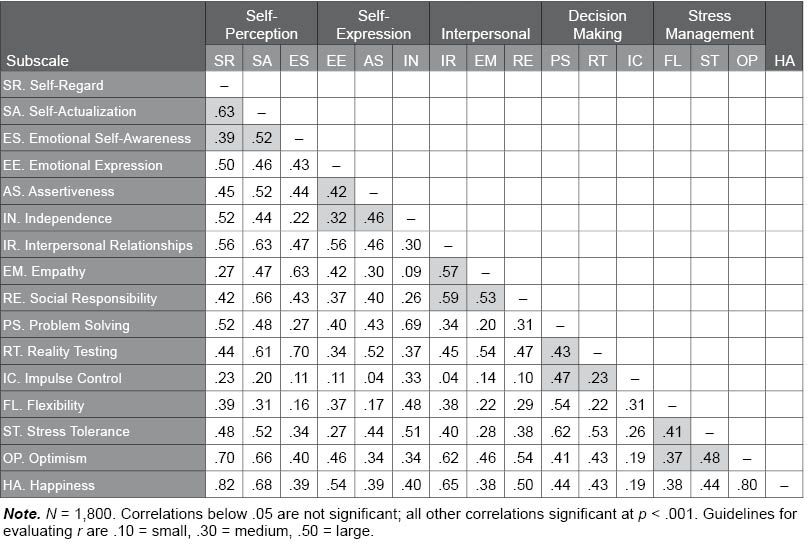
Table G.14. Relationship Between EQ-i 2.0 Scores and GPA in the Higher Education Normative Sample
The following table provides EQ-i 2.0 standard score scale means and standard deviations for the GPA groups in the Higher Education normative sample. F and p values convey the statistical significance of group differences; p values lower than .01, which were found for most scales, suggest significant differences among the GPA groups. Partial η2 values provide an effect size for describing the effects as small, medium, or large. Meaningful effect sizes (i.e., partial η2 ≥ .01) suggest differences among respondents based on GPA.
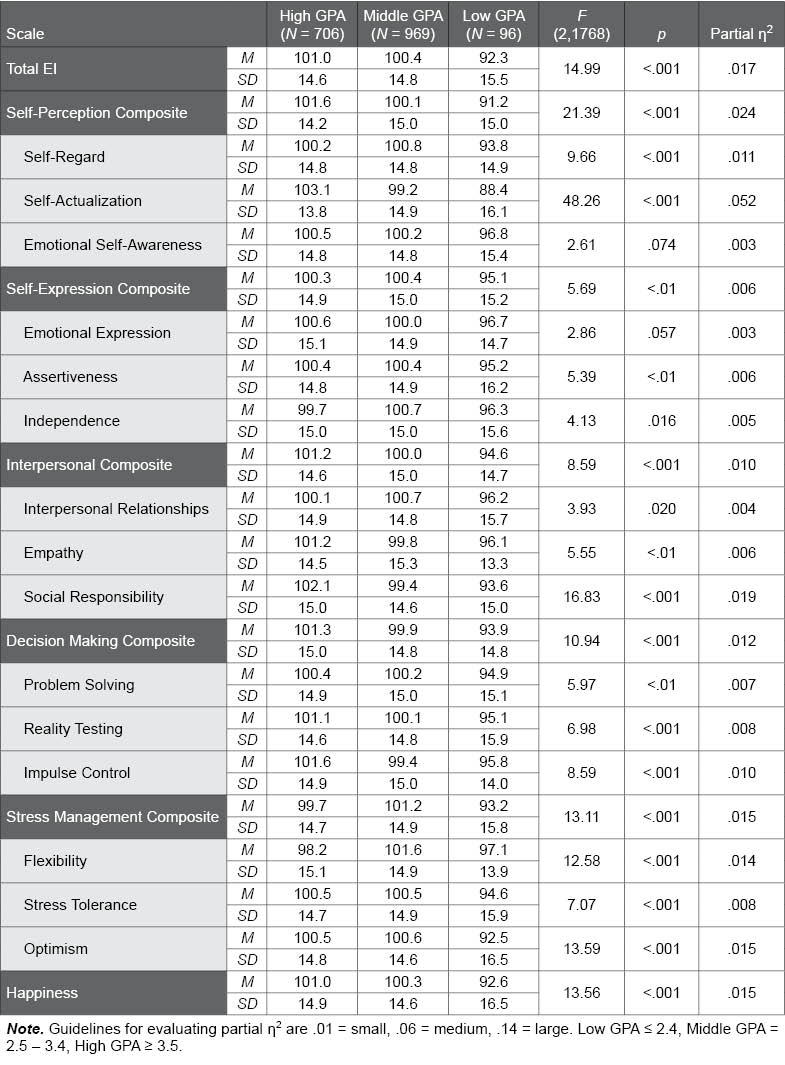
Table G.15. Effect Sizes for GPA Group Differences in the EQ-i 2.0 Higher Education Normative Sample
The following table provides effect sizes for pairwise comparisons of GPA group scale means in the EQ-i 2.0 Higher Education normative sample.
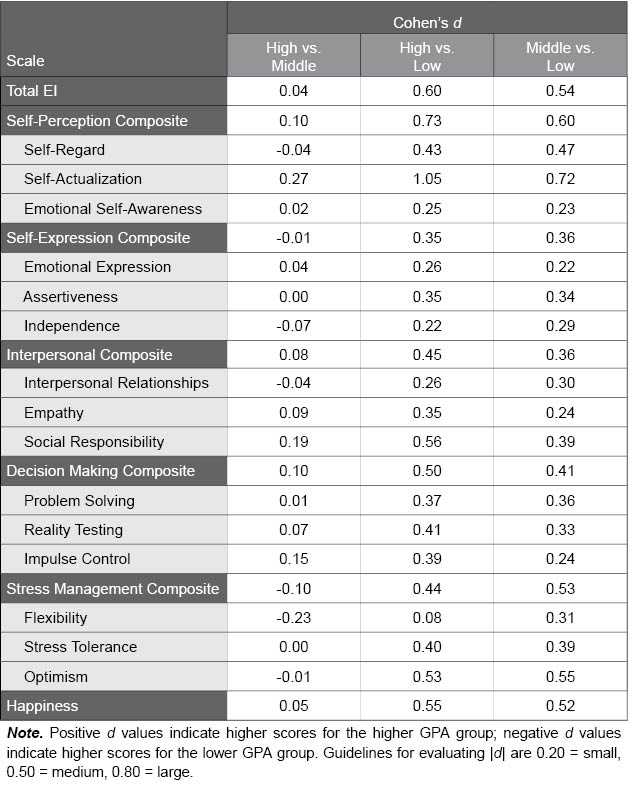
Table G.16. Program of Study Group Differences in the EQ-i 2.0 Higher Education Normative Sample
The following table provides EQ-i 2.0 standard score scale means and standard deviations for the various program of study groups in the Higher Education normative sample. F and p values convey the statistical significance of program of study group differences; p values lower than .01, which were only found for two scales, suggest significant differences among the groups. Partial η2 values provide an effect size for describing the effects as small, medium, or large. Meaningful effect sizes (i.e., partial η2 ≥ .01) suggest differences among respondents based on program of study.
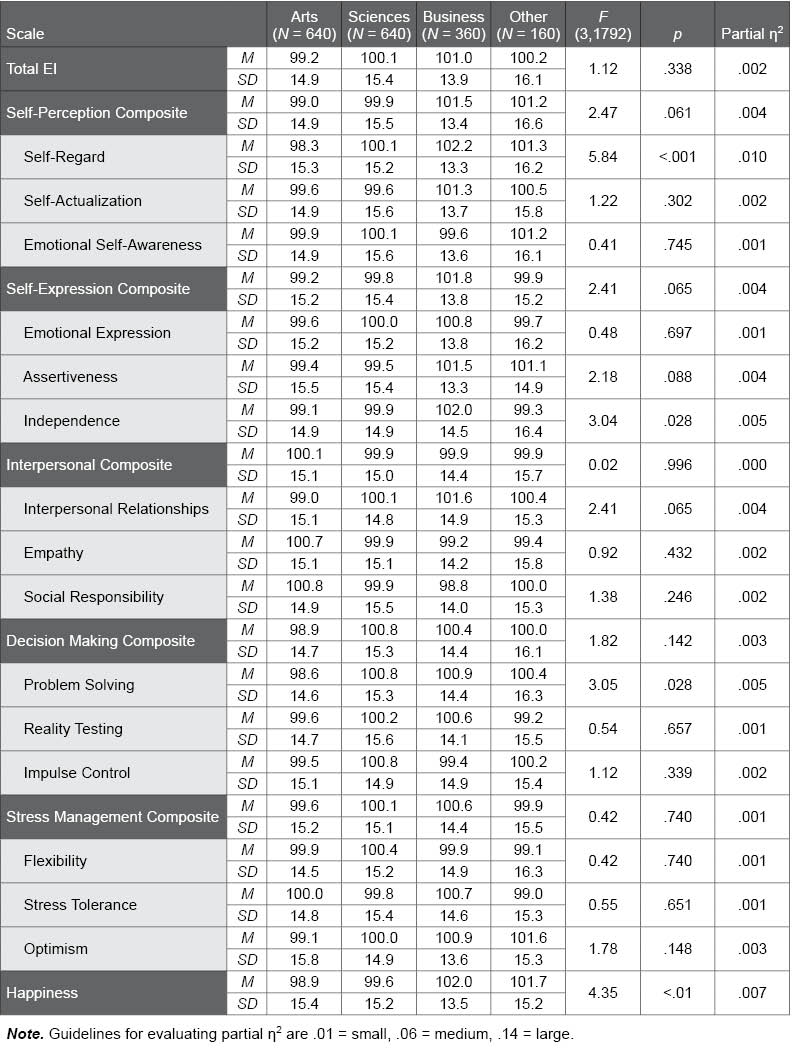
Table G.17. Race/Ethnicity Group Differences in the EQ-i 2.0 Higher Education Normative Sample
The following table provides EQ-i 2.0 standard score scale means and standard deviations for the various race/ethnicity groups in the Higher Education normative sample. F and p values convey the statistical significance of group differences; p values lower than .01 suggest significant differences among the groups. Partial η2 values provide an effect size for describing the effects as small, medium, or large. Meaningful effect sizes (i.e., partial η2 ≥ .01) suggest differences among respondents based on race/ethnicity.