Appendix G: EQ-i® 2.0 Higher Education Norms
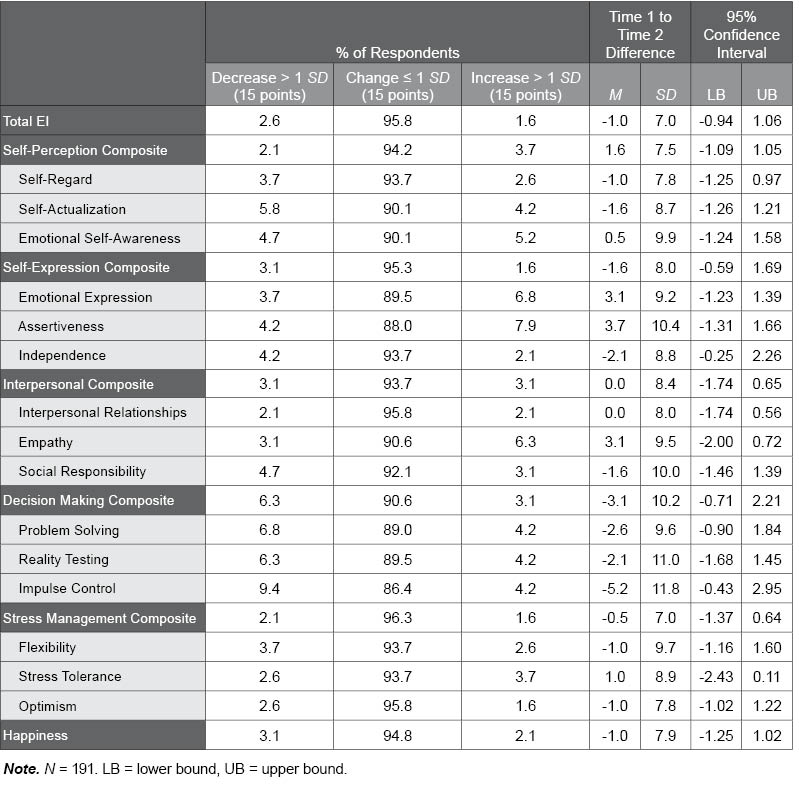
Table G.11. Test-Retest Stability in the EQ-i 2.0 Higher Education Sample
The following table presents stability information for the EQ-i 2.0 Higher Education test-retest sample. The first set of results lists the percentage of respondents whose scores decreased by more than 15 points, changed by 15 points or less, or increased by more than 15 points over time. Test-retest stability is supported if the majority of respondents show changes of 15 points or less over time, as found in the EQ-i 2.0 Higher Education test-retest sample. The mean and standard deviation of these differences across participants is also provided, along with the 95% confidence interval, which illustrates whether the difference is statistically meaningful for the sample as a whole. That is, if the confidence interval includes zero between the lower bound (LB) and upper bound (UB), the difference is not statistically meaningful, as was found for all of the EQ-i 2.0 scales and subscales.
