Appendix G: EQ-i® 2.0 Higher Education Norms
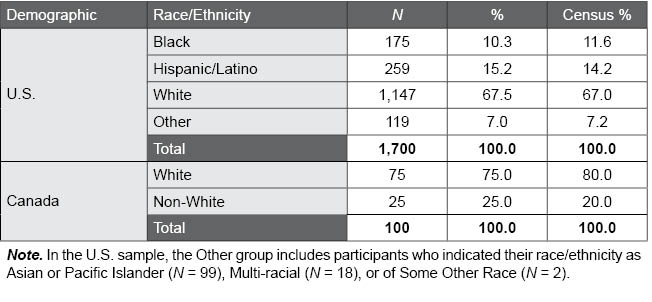
Table G.4. Race/Ethnicity Distribution of the EQ-i 2.0 Higher Education Normative Sample
The following table presents the race/ethnicity distribution for the EQ-i 2.0 Higher Education normative sample along with U.S. and Canadian Census information for adults (Statistics Canada, 2006; U.S. Bureau of the Census, 2010). The EQ-i 2.0 normative sample showed percentages within 5% for each racial/ethnic group (most within 2.0%), suggesting it is very similar to the Census.