Appendix G: EQ-i® 2.0 Higher Education Norms
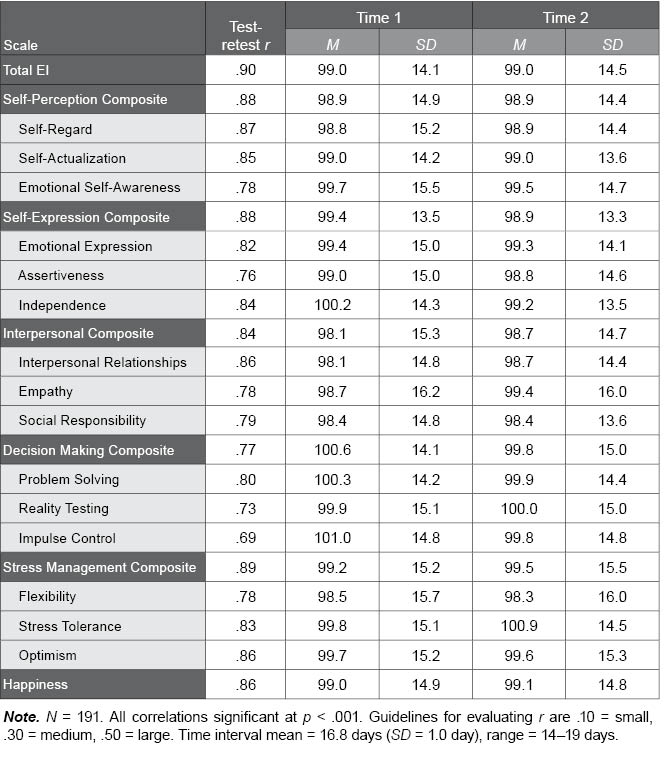
Table G.10. Test-Retest Correlations and Descriptive Statistics in the EQ-i 2.0 Higher Education Sample
The following table presents test-retest correlations and the Time 1 and Time 2 means and standard deviations for the EQ-i 2.0 scales in the Higher Education test-retest sample. Note that these correlations have been corrected for range-restriction. Correlations range from 0.00 to 1.00. Higher values, as found in the EQ-i 2.0 test-retest sample, suggest excellent test-retest reliability.