Appendix G: EQ-i® 2.0 Higher Education Norms
Table G.16. Program of Study Group Differences in the EQ-i 2.0 Higher Education Normative Sample
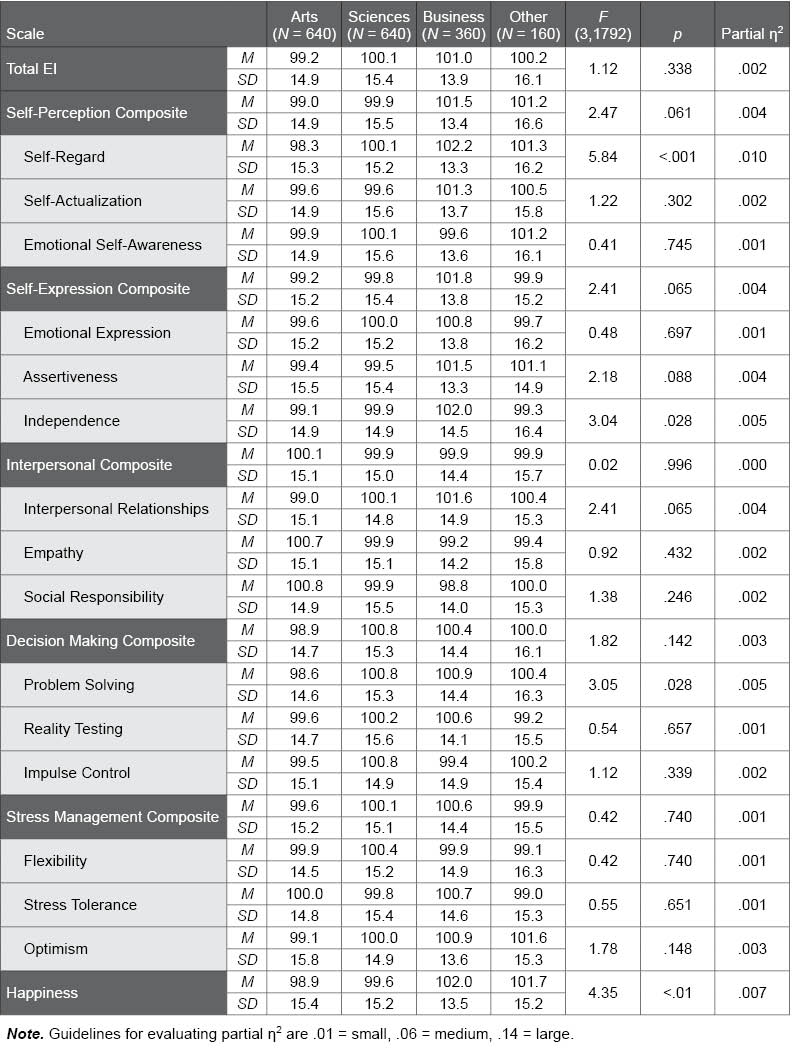
The following table provides EQ-i 2.0 standard score scale means and standard deviations for the various program of study groups in the Higher Education normative sample. F and p values convey the statistical significance of program of study group differences; p values lower than .01, which were only found for two scales, suggest significant differences among the groups. Partial η2 values provide an effect size for describing the effects as small, medium, or large. Meaningful effect sizes (i.e., partial η2 ≥ .01) suggest differences among respondents based on program of study.