


Appendix C: EQ-i® 2.0 UK and Ireland Norms
This appendix presents the statistical results pertaining to the development of the UK and Ireland Norm samples, including the EQ-i 2.0 General Population and Professional Norms, as well as the EQ 360 2.0 norms. Please see UK and Ireland Norms for full interpretive text.
- Table C.1. Age x Gender Distribution of UK and Ireland EQ-i 2.0 Normative Sample
- Table C.2. Race/Ethnicity Distribution of the UK and Ireland EQ-i 2.0 Normative Samples
- Table C.3. Geographic Region Distribution of UK and Ireland EQ-i 2.0 Normative Samples
- Table C.4. Education Level Distribution of UK and Ireland EQ-i 2.0 Normative Samples
- Table C.5. Multivariate Effects of Age and Gender in the EQ-i 2.0 UK and Ireland Norm Sample
- Table C.6. Effect Sizes for Gender and Age Effects in the EQ-i 2.0 UK and Ireland Norm Sample
- Table C.7. Gender Differences in the EQ-i 2.0 UK and Ireland Norm Sample
- Table C.8. Age Differences in the EQ-i 2.0 UK and Ireland Norm Sample
- Figure C.1. Histogram of EQ-i 2.0 Total EI Standard Scores in the UK and Ireland Normative Sample
- Table C.9. UK and Ireland General Population Norm Sample Scored with North American General Population Norms
- Table C.10. Internal Consistency of EQ-i 2.0 Scales in the UK and Ireland Norm Sample
- Table C.11. Correlations Among EQ-i 2.0 Composite Scales in the UK and Ireland Norm Sample
- Table C.12. Correlations Among EQ-i 2.0 Subscales in the UK and Ireland Norm Sample
- Table C.13. Age x Gender Distribution of the EQ-i 2.0 UK and Ireland Professional Norm Sample
- Table C.14. Employment Area Distribution of the EQ-i 2.0 UK and Ireland Professional Norm Sample
- Table C.15. Multivariate Effects of Age and Gender in the EQ-i 2.0 UK and Ireland Professional Norm Sample
- Table C.16. Effect Sizes for Gender and Age Effects in the EQ-i 2.0 UK and Ireland Professional Norm Sample
- Table C.17. Gender Differences in the EQ-i 2.0 UK and Ireland Professional Norm Sample
- Table C.18. Age Differences in the EQ-i 2.0 UK and Ireland Professional Norm Sample
- Figure C.2. Histogram of EQ-i 2.0 Total EI Standard Scores in the UK and Ireland Professional Norm Sample
- Table C.19. UK and Ireland Professional Norm Sample Scored with North American Professional Norms
- Table C.20. Internal Consistency: EQ-i 2.0 UK and Ireland Professional Norm Sample
- Table C.21. UK and Ireland Professional Norm Sample Scored with UK and Ireland General Population Norms.
- Table C.22. EQ-i 2.0 Scores in a UK and Ireland Customer Sample
- Figure C.3. Histogram of the Total EI Scores in the UK and Ireland Customer Sample
- Table C.23. Length of Rater/Ratee Relationship in UK and Ireland EQ 360 2.0 Normative Sample
- Table C.24. Strength of Rater/Ratee Relationship in UK and Ireland EQ 360 2.0 Normative Sample
- Table C.25. Frequency of Rater/Ratee Interactions in UK and Ireland EQ 360 2.0 Normative Sample
- Table C.26. Ratee Age Group by Gender Distribution in the UK and Ireland EQ 360 2.0 Normative Sample
- Table C.27. Distribution of Ratee Gender and Age Group by Rater Type in the UK and Ireland EQ 360 2.0 Normative Sample
- Table C.28. Distribution of Ratee Race/Ethnicity in the UK and Ireland EQ 360 2.0 Normative Sample
- Table C.29. Distribution of Ratee Geographic Region in the UK and Ireland EQ 360 2.0 Normative Sample
- Table C.30. Multivariate Effects of Ratee Age, Gender and Rater Type on the EQ 360 2.0 Scores in the UK and Ireland Norm Sample
- Table C.31. Effect Sizes for Gender, Age and Rater Type Effects in the UK and Ireland EQ 360 Norm Sample
- Table C.32. Ratee Gender Differences in EQ 360 2.0 Scores in the UK and Ireland Norm Sample
- Table C.33. Ratee Age Differences in EQ 360 2.0 Scores in the UK and Ireland Norm Sample
- Table C.34. Rater Type Differences in EQ 360 2.0 Scores in the UK and Ireland Norm Sample
- Figure C.4. Histogram of EQ 360 2.0 Total EI Standard Scores in the UK and Ireland Norm Sample
- Table C.35. UK and Ireland EQ 360 2.0 General Population Norm Sample Scored with North American General Population Norms
- Table C.36. Internal Consistency of EQ 360 2.0 Scales in the UK and Ireland Norm Sample
- Table C.37. Correlations among EQ 360 2.0 Composite Scales in the UK and Ireland Norm Sample
- Table C.38. Correlations Among EQ 360 2.0 Subscales in the UK and Ireland EQ 360 Norm Sample
Table C.1. Age x Gender Distribution of UK and Ireland EQ-i 2.0 Normative Sample
The following table presents the distribution of the UK and Ireland EQ-i 2.0 normative sample, categorised by age group and gender. An equal number of males and females were sampled at each age group.
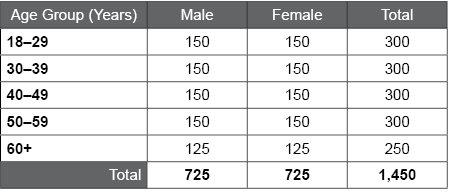
Table C.2. Race/Ethnicity Distribution of the UK and Ireland EQ-i 2.0 Normative Samples
The following table summarises the race/ethnicity distribution of the UK EQ-i 2.0 normative sample. The non-White group comprises individuals who identified themselves as being of a mixed race, Indian, Black, or of some other race. The normative sample shows race/ethnicity proportions similar to Census. The percentages shown below match closely to Census targets for both countries, suggesting the normative sample is representative of the UK and Ireland general populations. Cases in the sample were weighted so that education level percentages would be closer to census. The weighting used to address the education level percentages also has a slight effect on the percentages for other demographic variables. As a result, weighted percentages are shown for all of the demographic variables.
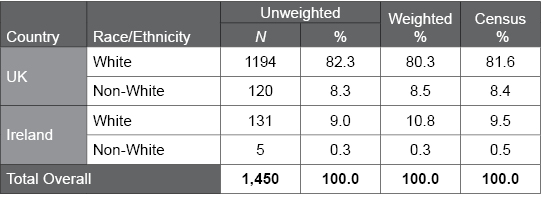
Table C.3. Geographic Region Distribution of UK and Ireland EQ-i 2.0 Normative Samples
The following table summarises the geographic region distribution of the UK and Ireland EQ-i 2.0 normative sample. The proportions for each region are similar to the Census, which suggests the normative sample is representative of the general population in terms of region.

Table C.4. Education Level Distribution of UK and Ireland EQ-i 2.0 Normative Samples
The following table summarises the education level (i.e., highest level of attained education) distribution of the normative sample for each country. Education level is weighted so that the weighted proportions match closely to Census targets (within 4%).
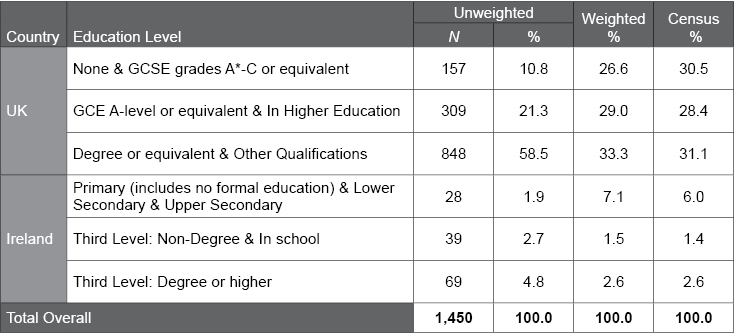
Table C.5. Multivariate Effects of Age and Gender in the EQ-i 2.0 UK and Ireland Norm Sample
The following table summarises the results from the multivariate analyses of covariance (MANCOVAs) conducted on the composite scales and subscales to examine effects of gender, age, and the interaction between gender and age on EQ-i 2.0 scores in the UK and Ireland normative sample. Wilks’ lambda ranges from 0.00 to 1.00 and depicts the amount of variance not explained by the demographic variable. F and p values convey the statistical significance of the effect. Partial η2 values provide an effect size for describing the effects as small, medium, or large. Meaningful effect sizes (i.e., partial η2 ≥ .01) suggest differences among participants based on the demographic variable.
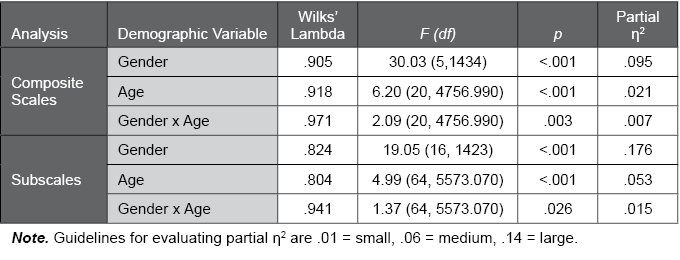
Table C.6. Effect Sizes for Gender and Age Effects in the EQ-i 2.0 UK and Ireland Norm Sample
The following table summarises the effect sizes for the effects of gender, age, and the gender x age interaction on the EQ-i 2.0 Total EI score, composite scales, and subscales in the UK and Ireland normative sample. Meaningful effect sizes (i.e., |d| ≥ 0.20, partial η2 ≥ .01) suggest differences among participants based on the demographic variable, and that separate demographic norm groups may be required.
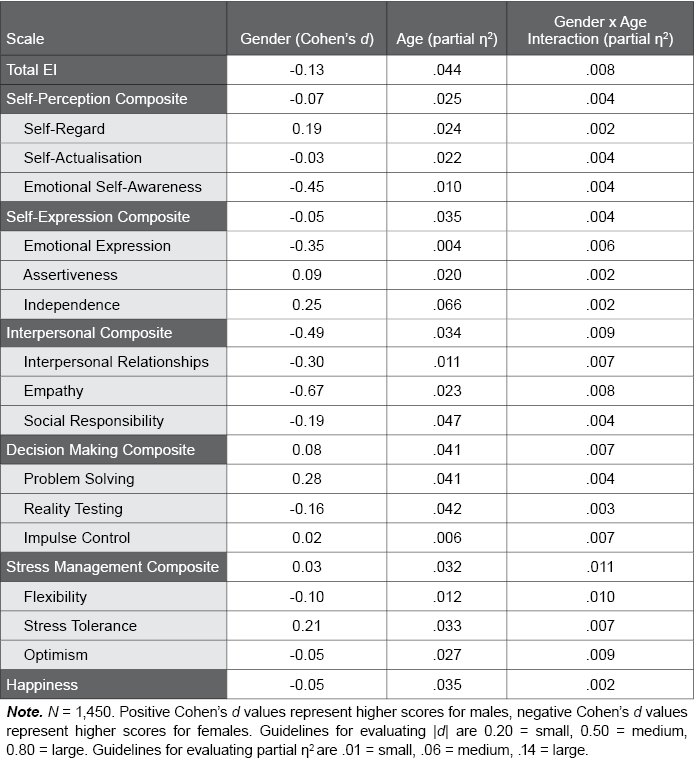
Table C.7. Gender Differences in the EQ-i 2.0 UK and Ireland Norm Sample
The following table provides EQ-i 2.0 scale means and standard deviations for males and females in the UK and Ireland normative sample. F and p values convey the statistical significance of gender differences; p values lower than .01, which were found for several scales, suggest significant differences between males and females.
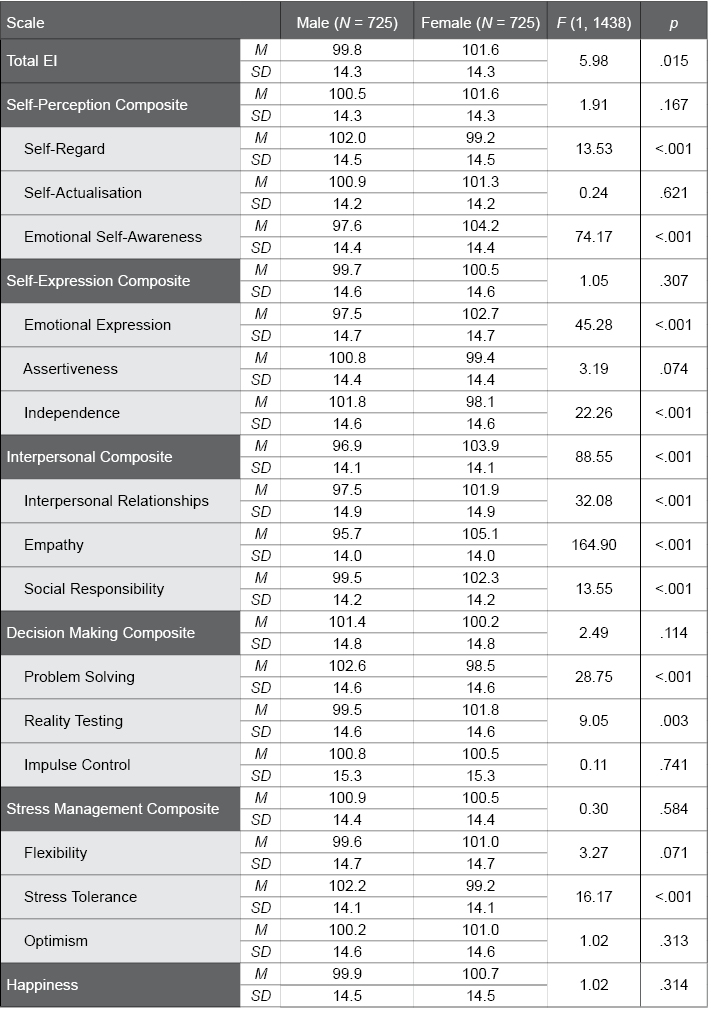
Table C.8. Age Differences in the EQ-i 2.0 UK and Ireland Norm Sample
The following table provides EQ-i 2.0 scale means and standard deviations for the various age groups in the UK and Ireland normative sample. F and p values convey the statistical significance of age group differences; p values lower than .01, which were found for most scales, suggest significant differences among the age groups.
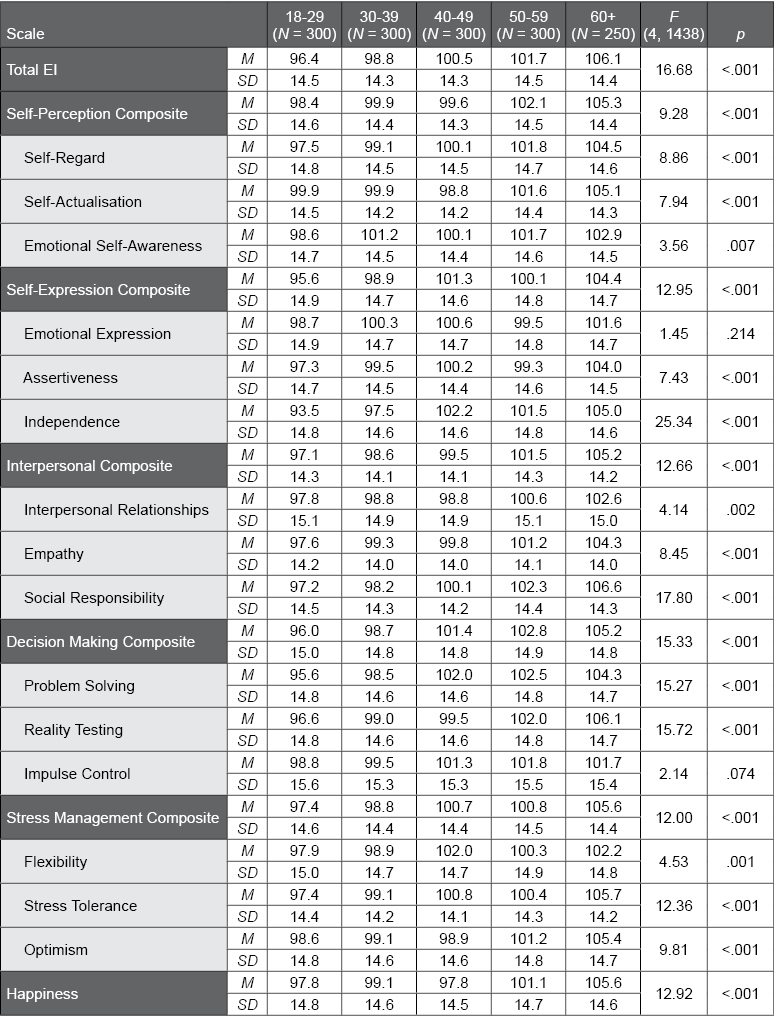
Figure C.1. Histogram of EQ-i 2.0 Total EI Standard Scores in the UK and Ireland Normative Sample
This figure illustrates the distribution of EQ-i 2.0 Total EI standard scores in the UK and Ireland General Population Norm sample. Distributions that approximate a normal (“bell-shaped”) curve (as indicated by the black curved line), such as those found in this figure, suggest that the Total EI scores closely approximate a bell-shaped (Gaussian) distribution. This suggests that it is unnecessary to apply a normalising transformation to the scores.
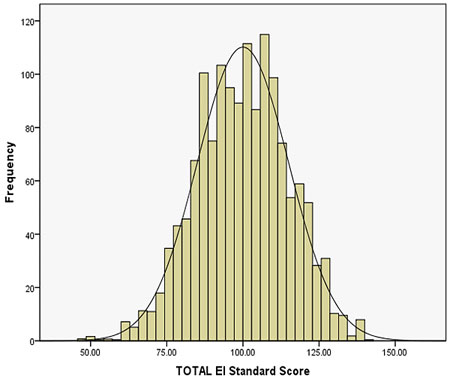
Table C.9. UK and Ireland General Population Norm Sample Scored with North American General Population Norms
The following table provides EQ-i 2.0 scale means and standard deviations for the UK and Ireland normative sample when scored with the North American norms, and compared against a mean of 100. Cohen’s d values provide an effect size to describe differences between the samples as small, medium, or large; t and p values provide statistical significance tests for these differences.
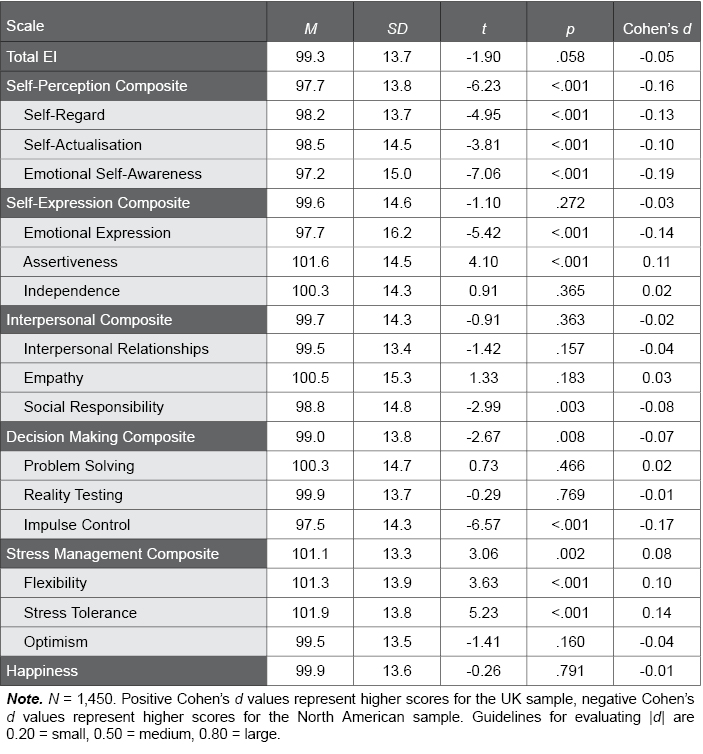
Table C.10. Internal Consistency of EQ-i 2.0 Scales in the UK and Ireland Norm Sample
The following table summarises the internal consistency (Cronbach’s alpha) values for the EQ-i 2.0 scales in the UK and Ireland normative sample, presented overall and separately by age and gender norm group. Alpha values range from 0.00 to 1.00. Higher values, like those found in the UK and Ireland normative sample, provide evidence for strong reliability.
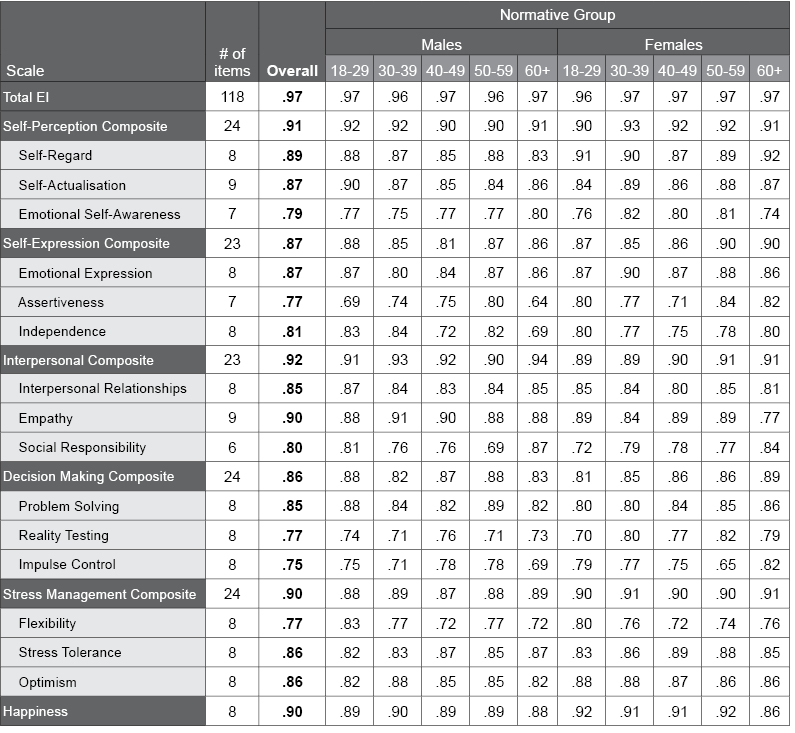
Table C.11. Correlations Among EQ-i 2.0 Composite Scales in the UK and Ireland Norm Sample
The following table illustrates the correlations among the EQ-i 2.0 composite scales in the UK and Ireland normative sample. Correlations range from 0.00 to 1.00, with higher values suggesting the scales share a relevant common psychological characteristic (i.e., emotional intelligence). Very high values (e.g., > .90) would suggest a unidimensional factor structure. Moderate to large sized correlations, like those found in the UK and Ireland normative sample, support both the concept that the scales measure a common psychological characteristic, as well as the multidimensional factor structure of the EQ-i 2.0.
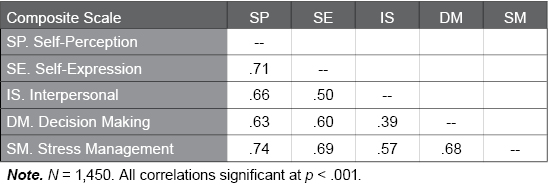
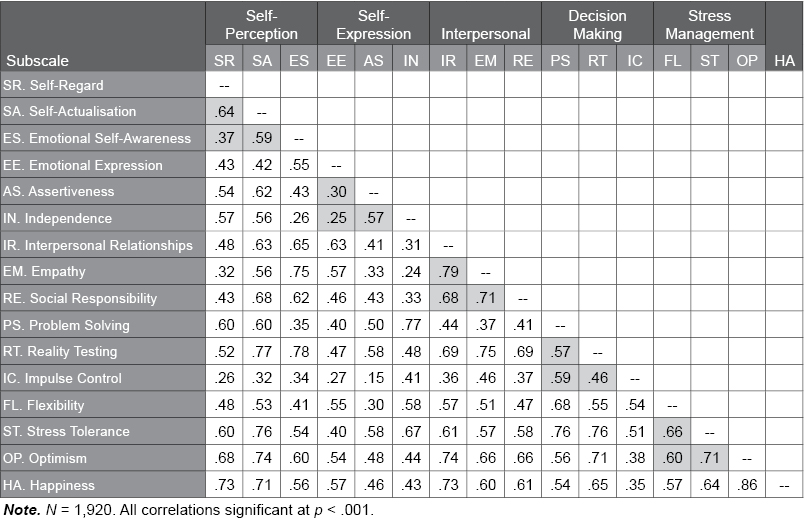
Table C.12. Correlations Among EQ-i 2.0 Subscales in the UK and Ireland Norm Sample
The following table illustrates the correlations among the EQ-i 2.0 subscales in the UK and Ireland normative sample. Correlations range from 0.00 to 1.00, with higher values suggesting the scales share a relevant common psychological characteristic. Shaded cells indicate correlations between subscales within the same composite scale. Moderate correlations were found within the composite scales, supporting both the concept that the scales measure a common psychological characteristic, as well as the multidimensional factor structure.
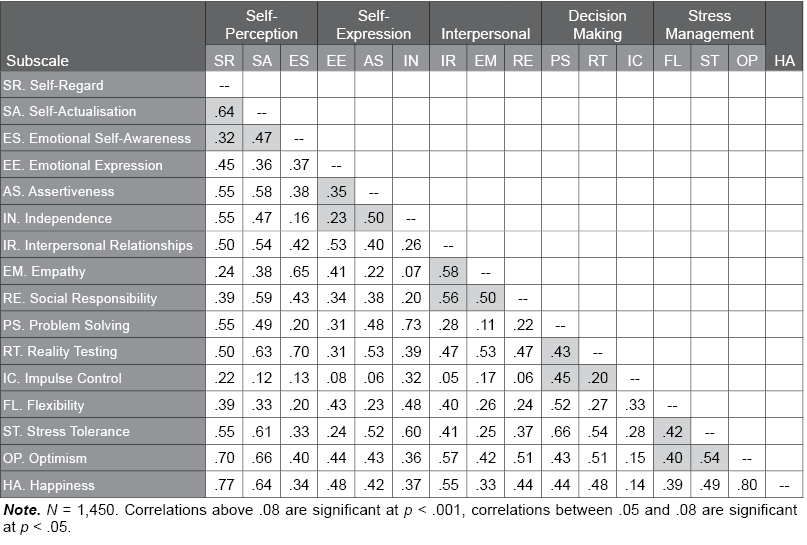
Table C.13. Age x Gender Distribution of the EQ-i 2.0 UK and Ireland Professional Norm Sample
The following table conveys the distribution of the UK and Ireland EQ-i 2.0 Professional Norm sample, categorised by age group and gender. An equal number of males and females were sampled at each age group.
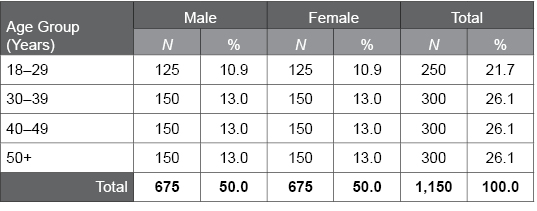
Table C.14. Employment Area Distribution of the EQ-i 2.0 UK and Ireland Professional Norm Sample
The following table summarises the employment area distribution of the EQ-i 2.0 UK and Ireland Professional Norm sample. The sample includes participants from a variety of employment areas.
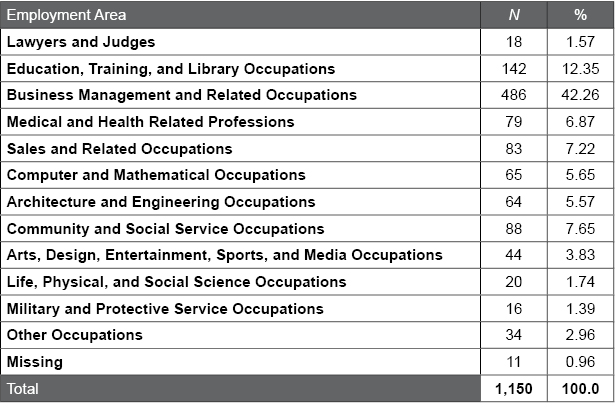
Table C.15. Multivariate Effects of Age and Gender in the EQ-i 2.0 UK and Ireland Professional Norm Sample
The following table summarises the results from the multivariate analyses of covariance (MANCOVAs) conducted on the composite scales and subscales to examine effects of gender, age, and the interaction between gender and age on EQ-i 2.0 scores in the UK and Ireland Professional Norm sample. Wilks’ lambda ranges from 0.00 to 1.00 and depicts the amount of variance not explained by the demographic variable. F and p values convey the statistical significance of the effect. Partial η2 values provide an effect size for describing the effects as small, medium, or large. Meaningful effect sizes (i.e., partial η2 ≥ .01) suggest differences among participants based on the demographic variable.
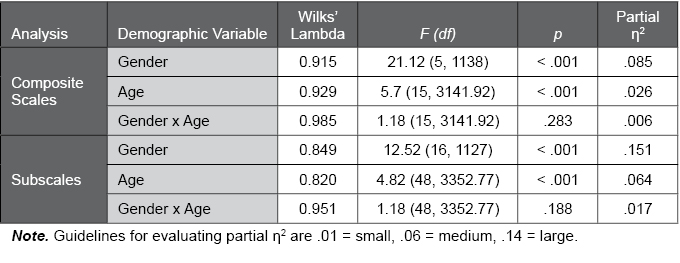
Table C.16. Effect Sizes for Gender and Age Effects in the EQ-i 2.0 UK and Ireland Professional Norm Sample
The following table summarises the effect sizes for the effects of gender, age, and the gender x age interaction on the EQ-i 2.0 Total EI score, composite scales, and subscales in the UK and Ireland Professional Norm sample. Meaningful effect sizes (i.e., |d| ≥ 0.20, partial η2 ≥ .01), which were found for several scales, suggest differences among participants based on age and gender, and that separate age and gender norms should be available as an option for this assessment.
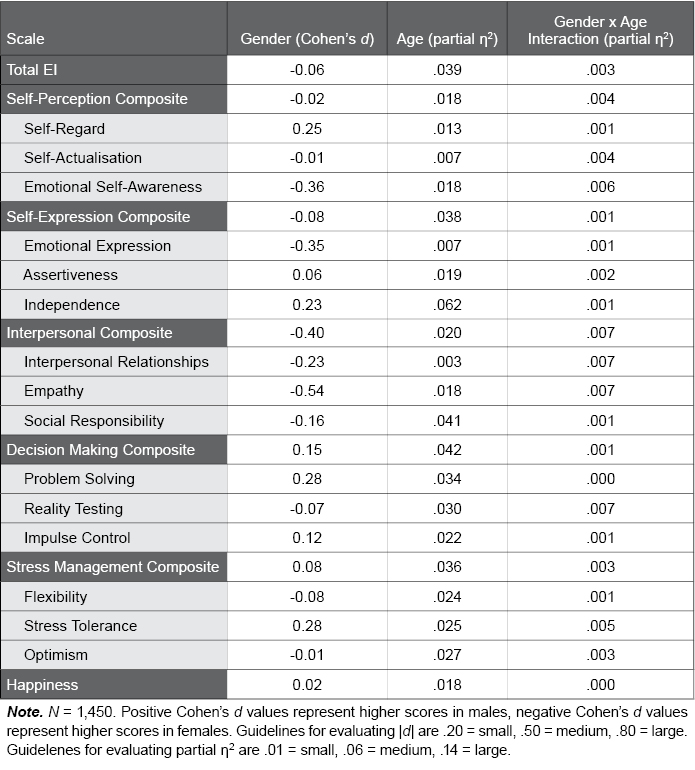
Table C.17. Gender Differences in the EQ-i 2.0 UK and Ireland Professional Norm Sample
The following table provides EQ-i 2.0 scale means and standard deviations for males and females in the UK and Ireland Professional Norm sample. F and p values convey the statistical significance of gender differences; p values lower than .01, which were found for many scales, suggest significant differences between males and females.
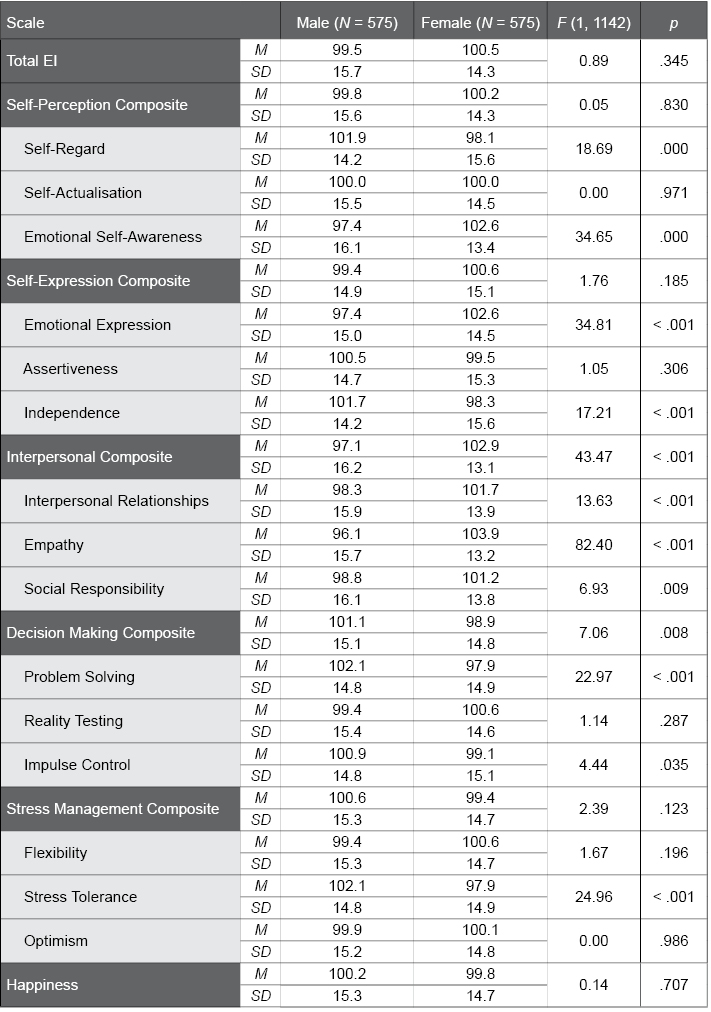
Table C.18. Age Differences in the EQ-i 2.0 UK and Ireland Professional Norm Sample
The following table provides EQ-i 2.0 scale means and standard deviations for the various age groups in the UK and Ireland Professional Norm sample. F and p values convey the statistical significance of age group differences; p values lower than .01, which were found for most scales, suggest significant differences among the age groups.
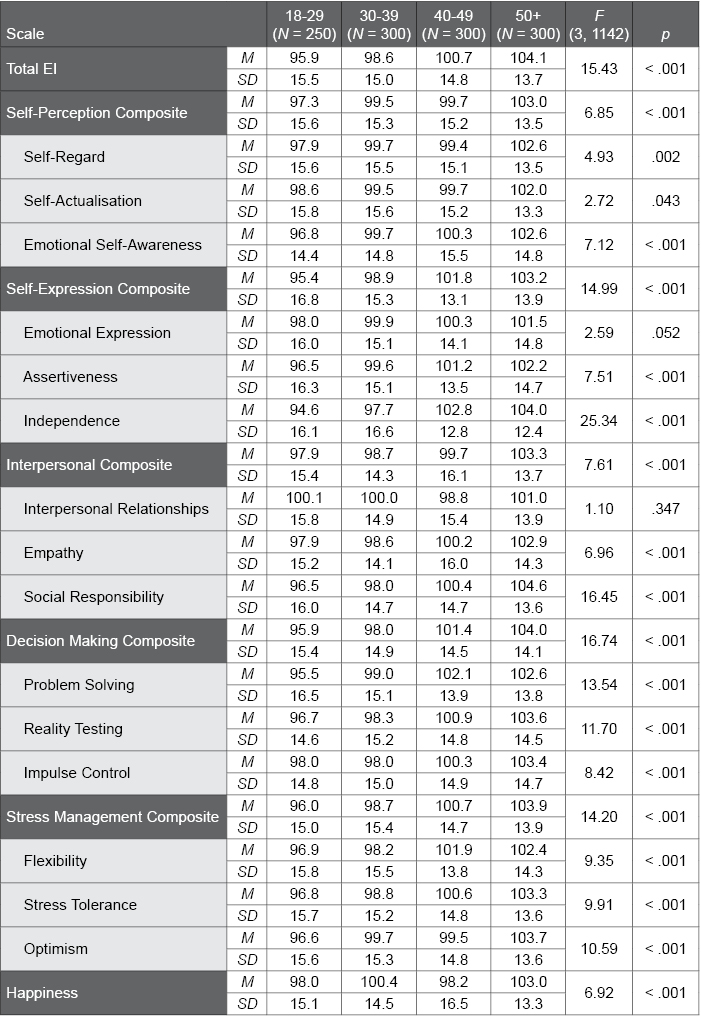
Figure C.2. Histogram of EQ-i 2.0 Total EI Standard Scores in the UK and Ireland Professional Norm Sample
This figure illustrates the distribution of EQ-i 2.0 Total EI standard scores in the UK and Ireland Professional Norm sample. Distributions that approximate a normal (“bell-shaped”) curve (as indicated by the black curved line), such as those found in this figure, suggest that the Total EI scores closely approximate a bell-shaped (Gaussian) distribution. This suggests that it is unnecessary to apply a normalising transformation to the scores.
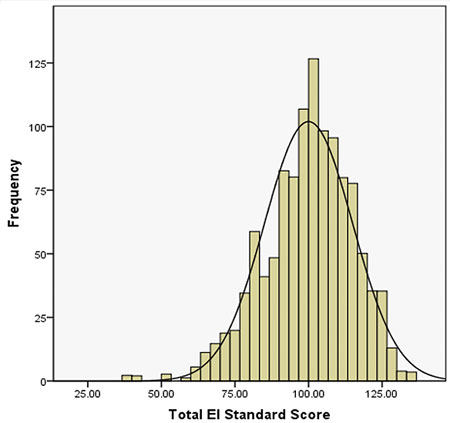
Table C.19. UK and Ireland Professional Norm Sample Scored with North American Professional Norms
The following table provides EQ-i 2.0 scale means and standard deviations for the UK and Ireland Professional Norm sample when scored with the North American Professional Norms, and compared against a mean of 100. Cohen’s d values provide an effect size to describe differences between the samples as small, medium, or large; t and p values provide statistical significance tests for these differences.
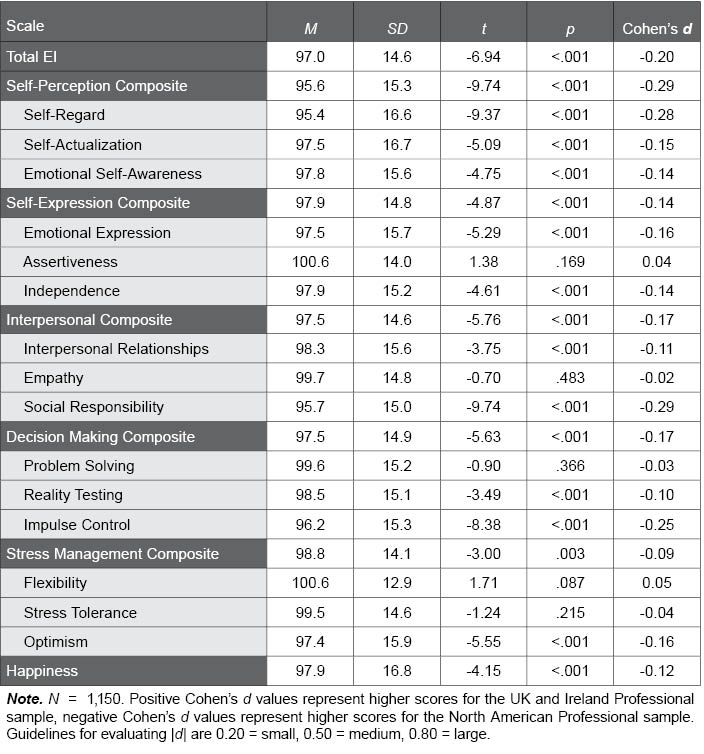
Table C.20. Internal Consistency: EQ-i 2.0 UK and Ireland Professional Norm Sample
The following table provides the internal consistency (Cronbach’s alpha) values for the EQ-i 2.0 scales in the UK and Ireland Professional Norm sample, presented overall and separately by age and gender norm group. Alpha values range from 0.00 to 1.00. Higher values, like those found in the UK and Ireland Professional Norm sample, provide evidence for strong reliability.
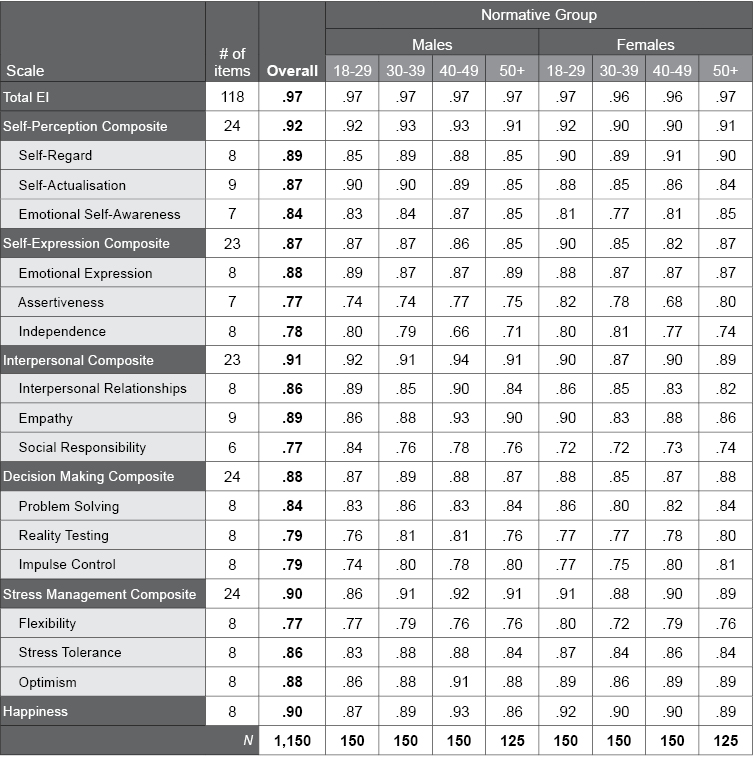
Table C.21. UK and Ireland Professional Norm Sample Scored with UK and Ireland General Population Norms.
The following table provides EQ-i 2.0 scale means and standard deviations for the UK and Ireland Professional Norm sample, computed with the UK and Ireland General Population norms. Compared against a mean of 100 for each scale, results indicate higher mean scores in the Professional sample.
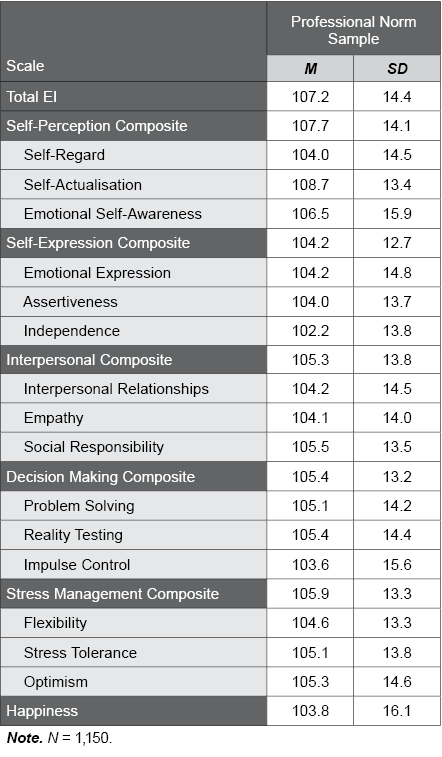
Table C.22. EQ-i 2.0 Scores in a UK and Ireland Customer Sample
The following table provides EQ-i 2.0 scale means and standard deviations in a UK and Ireland customer sample when scored with the UK and Ireland Professional norms. Means were all close to 100 and standard deviations were close to 15, indicating that scores for the customer sample closely match the scores obtained from individuals in the Professional Norm sample. This result provides validation that the Professional Norms will have good applicability for use in actual professional contexts.
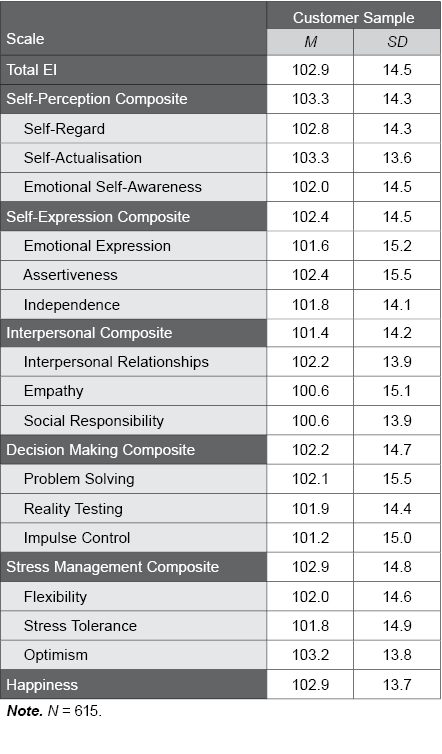
Figure C.3. Histogram of the Total EI Scores in the UK and Ireland Customer Sample
This figure illustrates the distribution of EQ-i 2.0 Total EI scores in the UK and Ireland customer sample (N=615) when scored with the UK and Ireland Professional Norms. The normal “bell-shaped” distribution of the data (as indicated by the black curved line in this figure) suggests that the Total EI scores for the UK and Ireland customer sample closely approximate the bell-shaped (Guassian) distribution.
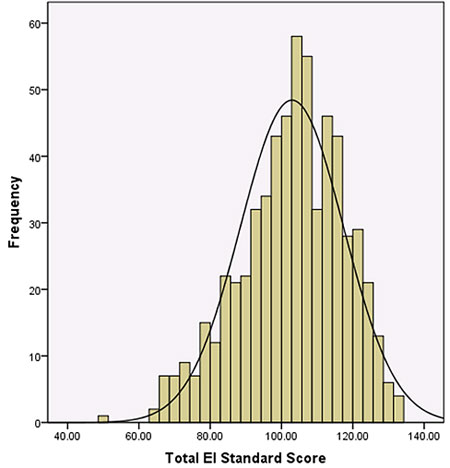
Table C.23. Length of Rater/Ratee Relationship in UK and Ireland EQ 360 2.0 Normative Sample
The following table describes the raters in the UK and Ireland EQ 360 normative sample in terms of the length of their relationship with the ratee. To ensure that raters had known the ratees long enough to have adequate knowledge about them, raters who knew ratees for less than 3 months were excluded from the sample. The majority of raters (over 90%) indicated that they knew the rate for at least one year.
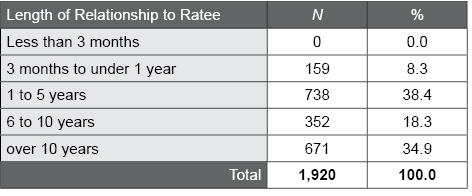
Table C.24. Strength of Rater/Ratee Relationship in UK and Ireland EQ 360 2.0 Normative Sample
The following table describes the raters in the UK and Ireland EQ 360 2.0 normative sample in terms of the strength of their relationship with the ratee. To ensure that raters had adequate knowledge about the ratees, raters who responded “Not Very Well” to the item about how well they know the ratee were excluded from the sample. All raters, therefore, knew the person they were rating at least “Fairly Well.”
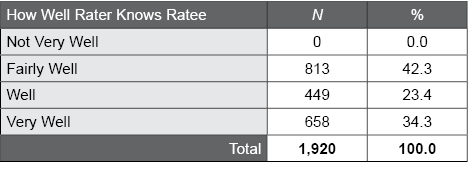
Table C.25. Frequency of Rater/Ratee Interactions in UK and Ireland EQ 360 2.0 Normative Sample
The following table describes the raters in the UK and Ireland EQ 360 2.0 normative sample in terms of the frequency of interaction with the ratee. Raters interact on a regular basis with the ratee which means the ratings are well-informed.
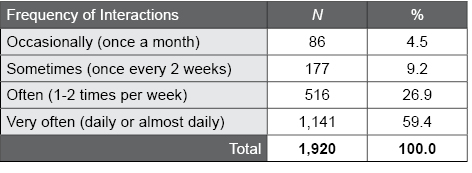
Table C.26. Ratee Age Group by Gender Distribution in the UK and Ireland EQ 360 2.0 Normative Sample
The following table describes the gender distribution of the UK and Ireland EQ 360 2.0 normative sample within age groups. The groups show similar proportions across gender and age groups.
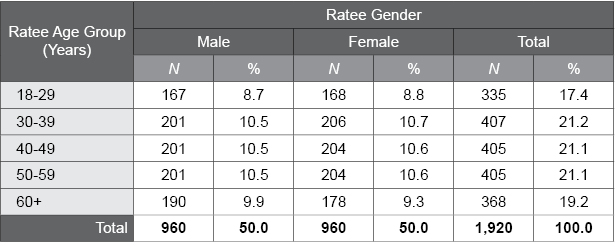
Table C.27. Distribution of Ratee Gender and Age Group by Rater Type in the UK and Ireland EQ 360 2.0 Normative Sample
The following table describes the gender and age group distribution of ratees in the UK and Ireland EQ 360 2.0 normative sample within each rater type.
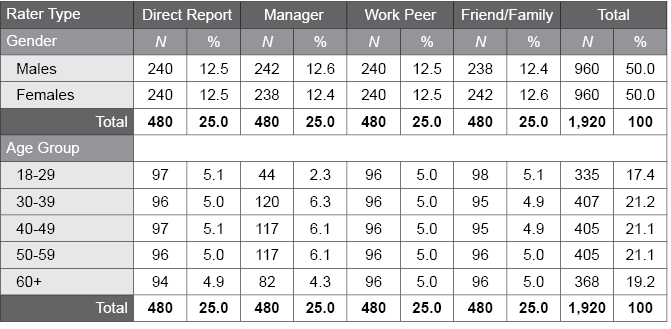
Table C.28. Distribution of Ratee Race/Ethnicity in the UK and Ireland EQ 360 2.0 Normative Sample
The following table summarises the racial/ethnic distribution of the UK and Ireland EQ 360 ratee sample by country. The normative sample shows race/ethnicity proportions similar to Census. The non-White group comprises individuals who were identified as being of a mixed race, Indian, Black, or of some other race.
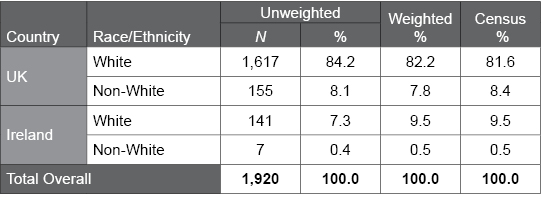
Table C.29. Distribution of Ratee Geographic Region in the UK and Ireland EQ 360 2.0 Normative Sample
The following table summarises the geographic region distribution of the UK and Ireland EQ 360 2.0 normative sample, along with Census information. The normative sample shows region proportions similar to Census. Weighted percentages for all regions match Census proportions within 1%, suggesting the data can be used to effectively represent the general population of the UK and Ireland.
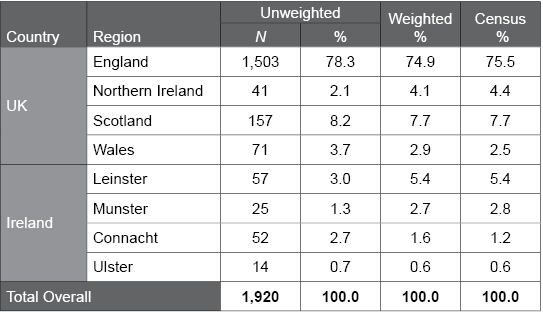
Table C.30. Multivariate Effects of Ratee Age, Gender and Rater Type on the EQ 360 2.0 Scores in the UK and Ireland Norm Sample
The following table summarises the results from the multivariate analyses of covariance (MANCOVAs) conducted on the EQ 360 2.0 composite scales and subscales to examine effects of gender, age, and rater type, and the interactions between these variables in the UK and Ireland normative sample. Wilks’ lambda ranges from 0.00 to 1.00 and depicts the amount of variance not explained by the demographic variable. F and p values convey the statistical significance of the effect. Partial η2 values provide an effect size for describing the effects as small, medium, or large. Meaningful effect sizes (i.e., partial η2 ≥ .01) suggest differences among participants based on the demographic variable.
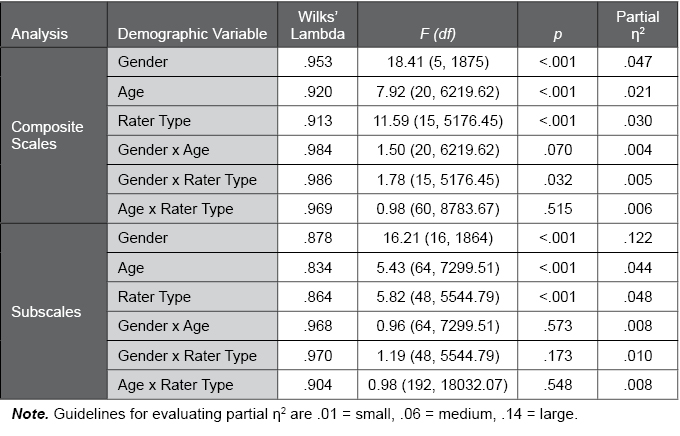
Table C.31. Effect Sizes for Gender, Age and Rater Type Effects in the UK and Ireland EQ 360 Norm Sample
The following table summarises the effect sizes for the effects of the ratee’s gender, ratee’s age, and rater type on the EQ 360 2.0 Total EI score, composite scales, and subscales in the UK and Ireland normative sample. The d and partial η2 values found in the UK and Ireland EQ 360 2.0 normative sample suggest negligible or very small effects of ratee gender, ratee age, and rater type. This result means that there is no need to have separate age and gender norms for the EQ 360 2.0.
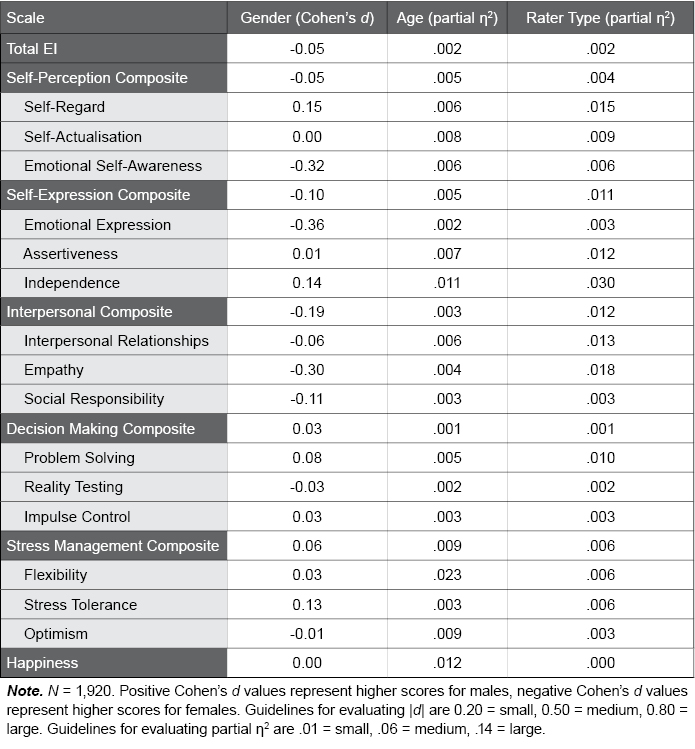
Table C.32. Ratee Gender Differences in EQ 360 2.0 Scores in the UK and Ireland Norm Sample
The following table provides EQ 360 2.0 scale means and standard deviations for males and females in the UK and Ireland EQ 360 2.0 normative sample. F and p values convey the statistical significance of gender differences; although some results were statistically significant, this was due to the large sample sizes, and the effect sizes were negligible for all of the scales (see Table C.31).
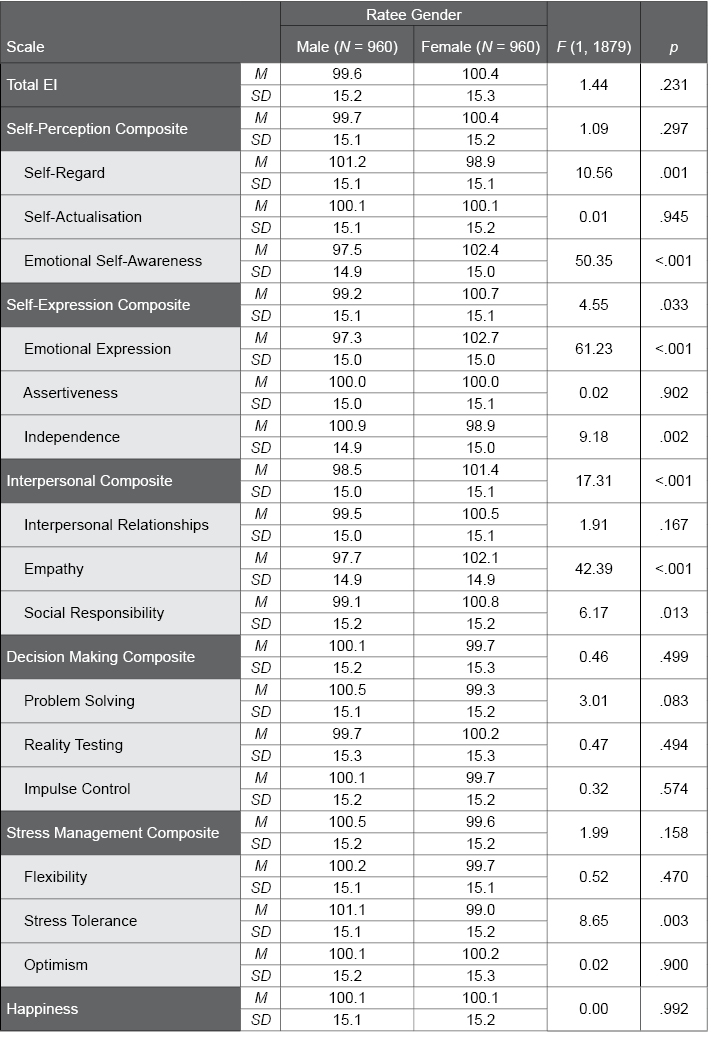
Table C.33. Ratee Age Differences in EQ 360 2.0 Scores in the UK and Ireland Norm Sample
The following table provides EQ 360 2.0 scale means and standard deviations for the various age groups in the UK and Ireland normative sample. F and p values convey the statistical significance of age group differences; although some results were statistically significant, this was due to the large sample sizes, and the effect sizes were negligible for all of the scales (see Table C.31).
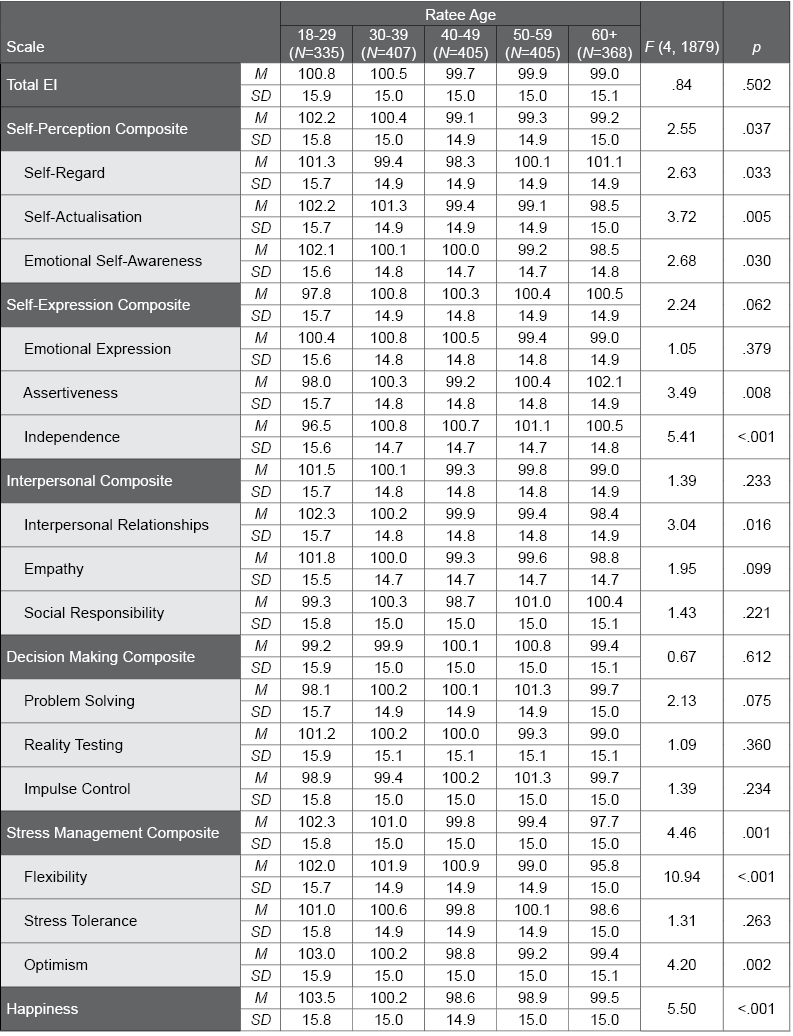
Table C.34. Rater Type Differences in EQ 360 2.0 Scores in the UK and Ireland Norm Sample
The following table provides EQ 360 2.0 scale means and standard deviations for the various rater types in the UK and Ireland normative sample. F and p values convey the statistical significance of rater type group differences; although some results were statistically significant, this was due to the large sample sizes, and the effect sizes were negligible for all of the scales (see Table C.31).
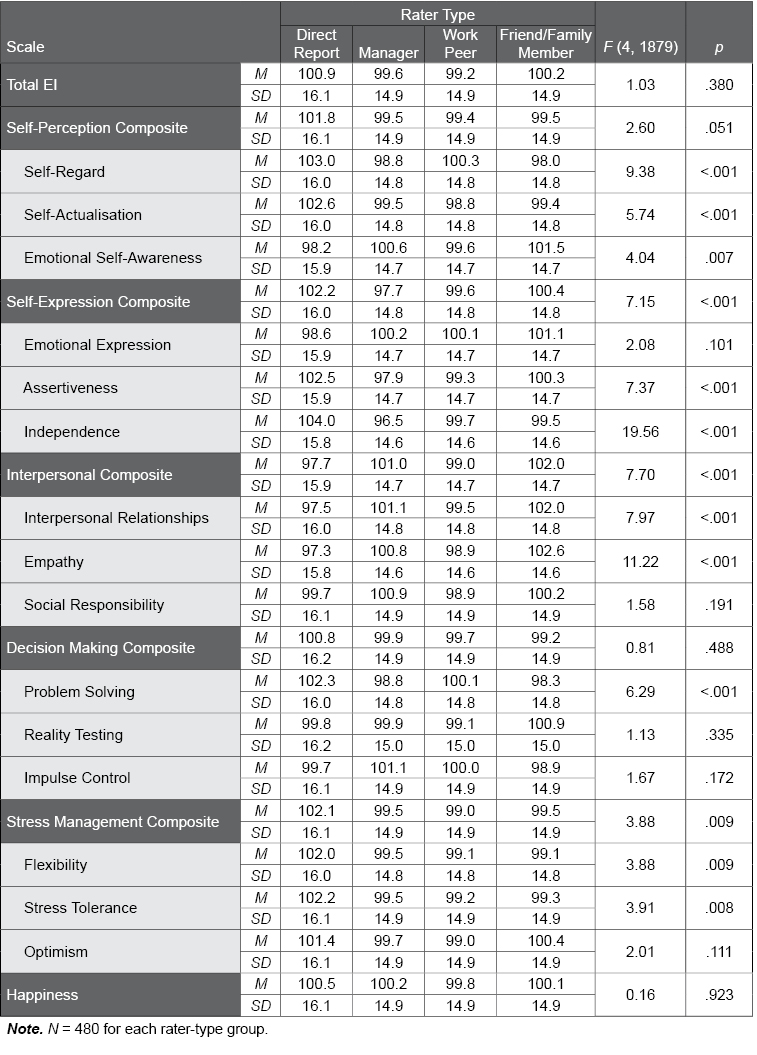
Figure C.4. Histogram of EQ 360 2.0 Total EI Standard Scores in the UK and Ireland Norm Sample
This figure illustrates the distribution of EQ 360 2.0 Total EI standard scores in the UK and Ireland normative sample. Distributions that approximate a normal (“bell-shaped”) curve (as indicated by the black curved line), such as those found in this figure, suggest that the Total EI scores closely approximate a bell-shaped (Gaussian) distribution. This suggests that it is unnecessary to apply a normalising transformation to the scores.
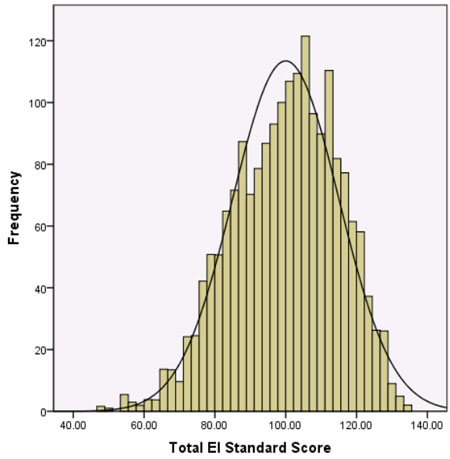
Table C.35. UK and Ireland EQ 360 2.0 General Population Norm Sample Scored with North American General Population Norms
The following table provides EQ 360 2.0 scale means and standard deviations for the UK and Ireland normative sample when scored with the North American EQ 360 2.0 norms, and compared against a mean of 100. Cohen’s d values provide an effect size to describe differences between the samples as small, medium, or large; t and p values provide statistical significance tests for these differences. The results indicate negligible differences between EQ 360 2.0 scores obtained from the UK and Ireland Norm general population norm sample and the North American 360 2.0 general population norms.
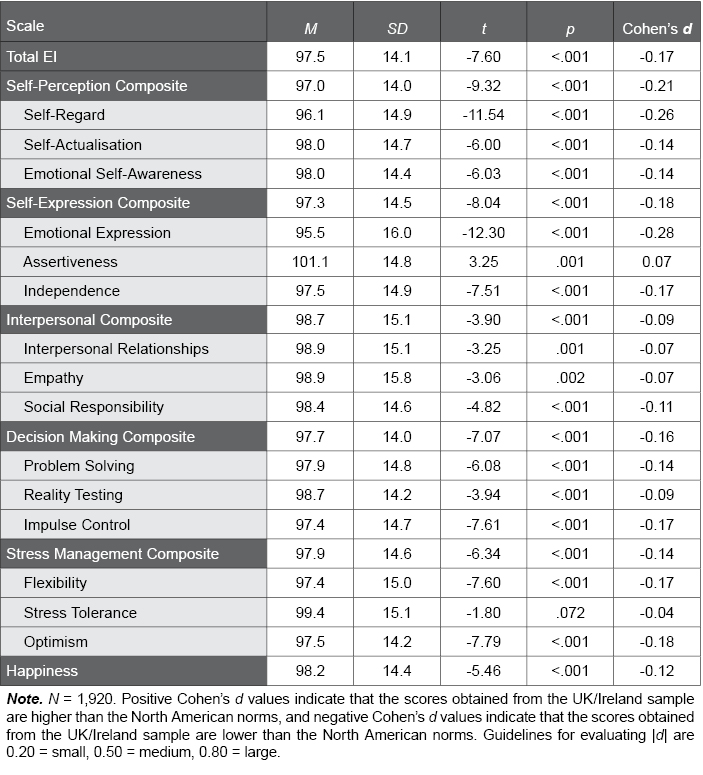
Table C.36. Internal Consistency of EQ 360 2.0 Scales in the UK and Ireland Norm Sample
The following table summarises the internal consistency (Cronbach’s alpha) values for the EQ 360 2.0 scales in the UK and Ireland normative sample. Alpha values range from 0.00 to 1.00. Higher values, as found in the UK and Ireland normative sample, provide evidence for the strong reliability of the EQ 360 2.0.
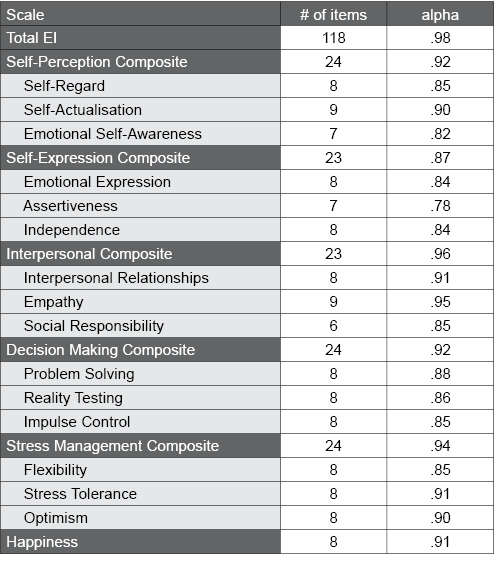
Table C.37. Correlations among EQ 360 2.0 Composite Scales in the UK and Ireland Norm Sample
The following table illustrates the correlations among the EQ 360 2.0 composite scales in the UK and Ireland normative sample. Correlations range from 0.00 to 1.00, with higher values suggesting the scales share a relevant common psychological characteristic (i.e., emotional intelligence). Very high values (e.g., > .90) would suggest a unidimensional factor structure. Moderate to large sized correlations, like those found in the UK and Ireland normative sample, support both the concept that the scales measure a common psychological characteristic, as well as the multidimensional factor structure of the EQ 360 2.0.
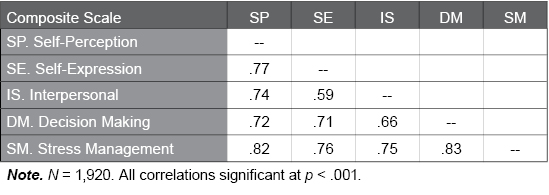
Table C.38. Correlations Among EQ 360 2.0 Subscales in the UK and Ireland EQ 360 Norm Sample
The following table illustrates the correlations among the EQ 360 2.0 subscales in the UK and Ireland normative sample. Correlations range from 0.00 to 1.00, with higher values suggesting the scales share a relevant common psychological characteristic. Shaded cells indicate correlations between subscales within the same composite scale. Moderate correlations were found within the composite scales, supporting the multidimensional factor structure of the EQ 360 2.0.