Appendix C: EQ-i® 2.0 UK and Ireland Norms
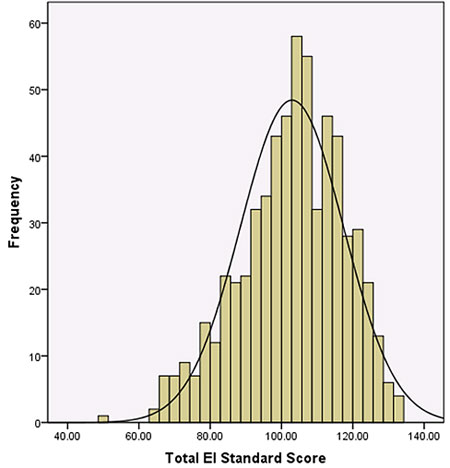
Figure C.3. Histogram of the Total EI Scores in the UK and Ireland Customer Sample
This figure illustrates the distribution of EQ-i 2.0 Total EI scores in the UK and Ireland customer sample (N=615) when scored with the UK and Ireland Professional Norms. The normal “bell-shaped” distribution of the data (as indicated by the black curved line in this figure) suggests that the Total EI scores for the UK and Ireland customer sample closely approximate the bell-shaped (Guassian) distribution.