Appendix C: EQ-i® 2.0 UK and Ireland Norms
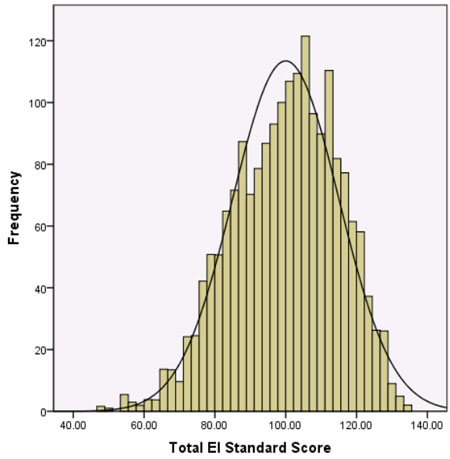
Figure C.4. Histogram of EQ 360 2.0 Total EI Standard Scores in the UK and Ireland Norm Sample
This figure illustrates the distribution of EQ 360 2.0 Total EI standard scores in the UK and Ireland normative sample. Distributions that approximate a normal (“bell-shaped”) curve (as indicated by the black curved line), such as those found in this figure, suggest that the Total EI scores closely approximate a bell-shaped (Gaussian) distribution. This suggests that it is unnecessary to apply a normalising transformation to the scores.