Appendix C: EQ-i® 2.0 UK and Ireland Norms
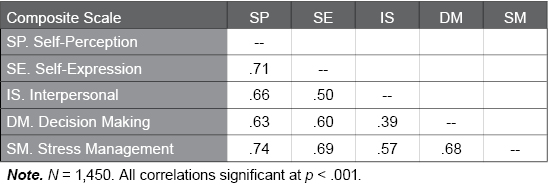
Table C.11. Correlations Among EQ-i 2.0 Composite Scales in the UK and Ireland Norm Sample
The following table illustrates the correlations among the EQ-i 2.0 composite scales in the UK and Ireland normative sample. Correlations range from 0.00 to 1.00, with higher values suggesting the scales share a relevant common psychological characteristic (i.e., emotional intelligence). Very high values (e.g., > .90) would suggest a unidimensional factor structure. Moderate to large sized correlations, like those found in the UK and Ireland normative sample, support both the concept that the scales measure a common psychological characteristic, as well as the multidimensional factor structure of the EQ-i 2.0.