Appendix C: EQ-i® 2.0 UK and Ireland Norms
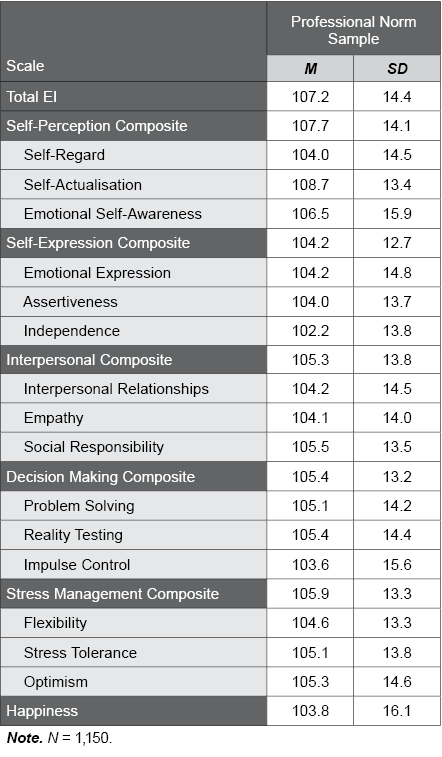
Table C.21. UK and Ireland Professional Norm Sample Scored with UK and Ireland General Population Norms.
The following table provides EQ-i 2.0 scale means and standard deviations for the UK and Ireland Professional Norm sample, computed with the UK and Ireland General Population norms. Compared against a mean of 100 for each scale, results indicate higher mean scores in the Professional sample.