Appendix C: EQ-i® 2.0 UK and Ireland Norms
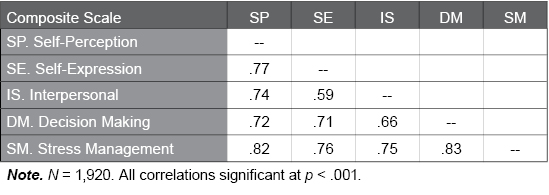
Table C.37. Correlations among EQ 360 2.0 Composite Scales in the UK and Ireland Norm Sample
The following table illustrates the correlations among the EQ 360 2.0 composite scales in the UK and Ireland normative sample. Correlations range from 0.00 to 1.00, with higher values suggesting the scales share a relevant common psychological characteristic (i.e., emotional intelligence). Very high values (e.g., > .90) would suggest a unidimensional factor structure. Moderate to large sized correlations, like those found in the UK and Ireland normative sample, support both the concept that the scales measure a common psychological characteristic, as well as the multidimensional factor structure of the EQ 360 2.0.