Appendix C: EQ-i® 2.0 UK and Ireland Norms
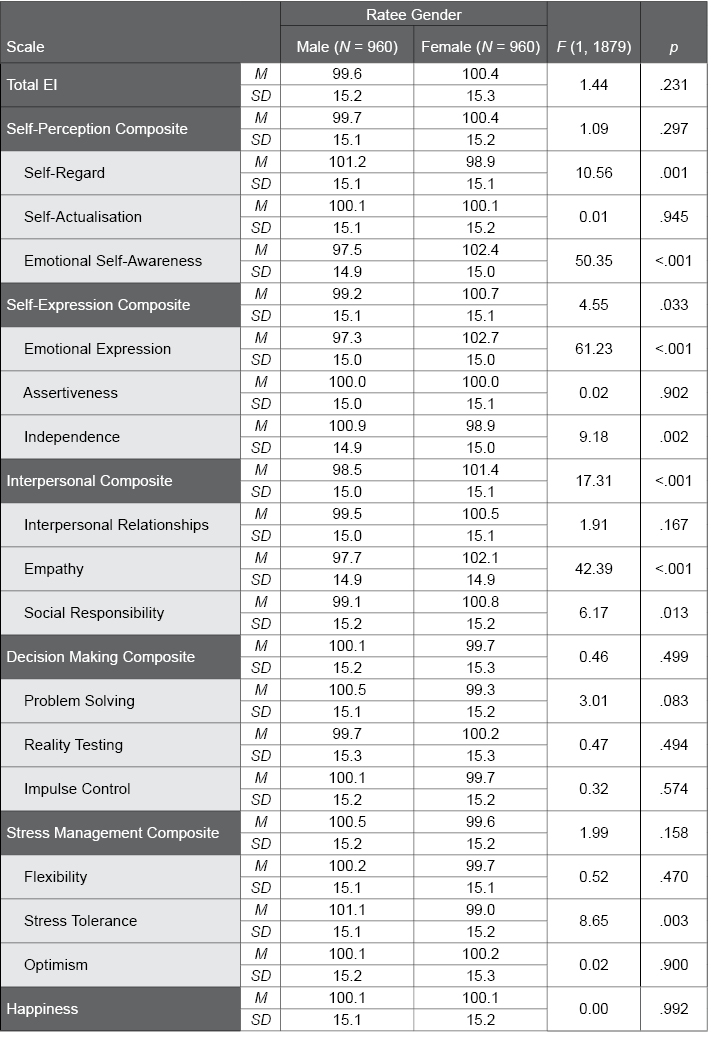
Table C.32. Ratee Gender Differences in EQ 360 2.0 Scores in the UK and Ireland Norm Sample
The following table provides EQ 360 2.0 scale means and standard deviations for males and females in the UK and Ireland EQ 360 2.0 normative sample. F and p values convey the statistical significance of gender differences; although some results were statistically significant, this was due to the large sample sizes, and the effect sizes were negligible for all of the scales (see Table C.31).