Appendix C: EQ-i® 2.0 UK and Ireland Norms
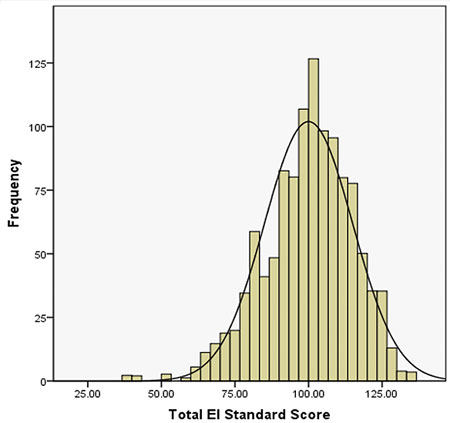
Figure C.2. Histogram of EQ-i 2.0 Total EI Standard Scores in the UK and Ireland Professional Norm Sample
This figure illustrates the distribution of EQ-i 2.0 Total EI standard scores in the UK and Ireland Professional Norm sample. Distributions that approximate a normal (“bell-shaped”) curve (as indicated by the black curved line), such as those found in this figure, suggest that the Total EI scores closely approximate a bell-shaped (Gaussian) distribution. This suggests that it is unnecessary to apply a normalising transformation to the scores.