


Appendix B: EQ-i® 2.0 North American Professional Norms
This appendix details the statistical results pertaining to the development of the EQ-i® 2.0 Professional Norm sample. Please see North American Professional Norms for full interpretive text.
- Table B.1. Age x Gender Distribution of the EQ-i 2.0 Professional Norm Sample
- Table B.2. Employment Area Distribution of the EQ-i 2.0 Professional Norm Sample
- Table B.3. Multivariate Effects of Age and Gender
- Table B.4. Effect Sizes for Gender and Age Effects in the EQ-i 2.0 Professional Norm Sample
- Table B.5. Gender Differences in EQ-i 2.0 Scores: Professional Norm Sample
- Table B.6. Age Differences in EQ-i 2.0 Scores: Professional Norm Sample
- Table B.7. Internal Consistency: EQ-i 2.0 Professional Normative Sample
- Table B.8. Comparison of Standard Scores from the General Population Norm Sample and Professional Norm Sample (Computed with General Population Norms)
- Table B.9. EQ-i 2.0 Customers Scored with Professional Norms
- Figure B.1. Histogram of EQ-i 2.0 Total EI Standard Scores in the Customer Sample
- Table B.10. Correlations Among EQ-i 2.0 Composite Scales in the Professional Normative Sample
- Table B.11. Correlations Among EQ-i 2.0 Subscales in the Professional Normative Sample
- Table B.12. Length of Rater/Ratee Relationship in the EQ 360 2.0 Professional Normative Sample
- Table B.13. Frequency of Rater/Ratee Interactions in the EQ 360 2.0 Professional Normative Sample
- Table B.14. Ratee Age Group by Gender Distribution in the EQ 360 2.0 Professional Normative Sample
- Table B.15. Distribution of Ratee Gender and Age Group by Rater Type in the EQ 360 2.0 Professional Normative Sample
- Table B.16. Employment Area Distribution of Ratees in the EQ 360 2.0 Professional Normative Sample
- Table B.17. Effect Sizes for Gender, Age, and Rater Type Effects in the EQ 360 2.0 Professional Normative Sample
- Table B.18. Gender Differences of Ratees in the EQ 360 2.0 Professional Normative Sample
- Table B.19. Ratee Age Differences in the EQ 360 2.0 Professional Norm Sample
- Table B.20. Rater Type Differences in the EQ 360 2.0 Professional Norm Sample
- Figure B.2. Histogram of EQ 360 2.0 Total EI Standard Scores in the Professional Normative Sample
- Table B.21. EQ 360 2.0 Professional Norm Sample Scored with EQ 360 2.0 General Population Norms
- Table B.22. Internal Consistency of EQ 360 2.0 Scales in the Professional Normative Sample
- Table B.23. Correlations Among EQ 360 2.0 Composite Scales in the Professional Normative Sample
- Table B.24. Correlations Among EQ 360 2.0 Subscales in the Professional Normative Sample
Table B.1. Age x Gender Distribution of the EQ-i 2.0 Professional Norm Sample
The following table conveys the distribution of participants in the EQ-i 2.0 Professional Norm sample, categorized by age group and gender. An ideal distribution is one that is similarly proportioned across all groups. The EQ-i 2.0 Professional Norm sample represents an ideal distribution because it demonstrates equal representation of all age × gender groups, until age 60+ where there are fewer cases (due to retirements).
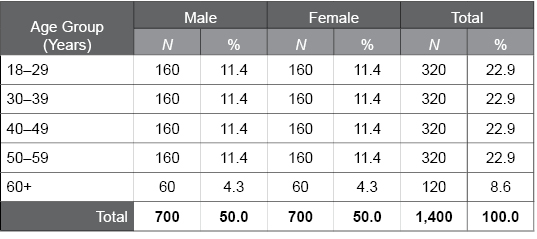
Table B.2. Employment Area Distribution of the EQ-i 2.0 Professional Norm Sample
The following table summarizes the employment area distribution of the EQ-i 2.0 Professional Norm sample. The sample should ideally include participants from a variety of employment areas, as is the case for this sample.
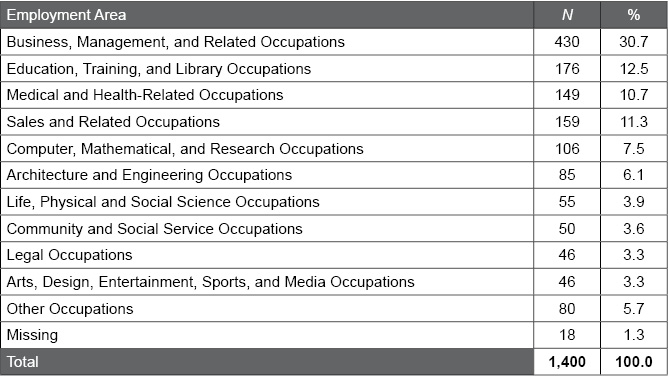
Table B.3. Multivariate Effects of Age and Gender
The following table summarizes the results from the multivariate analyses of covariance (MANCOVAs) conducted on the composite scales and subscales to examine potential effects of gender, age, and the interaction between gender and age on EQ-i 2.0 scores in the Professional Norm sample. Wilks’ lambda ranges from 0.00 to 1.00 and depicts the amount of variance not explained by the demographic variable. F and p values convey the statistical significance of the demographic variables. Partial η2 values provide an effect size for describing the effects as small, medium, or large. Meaningful effect sizes (i.e., partial η2 ≥ .01) suggest differences among participants based on the demographic variable.
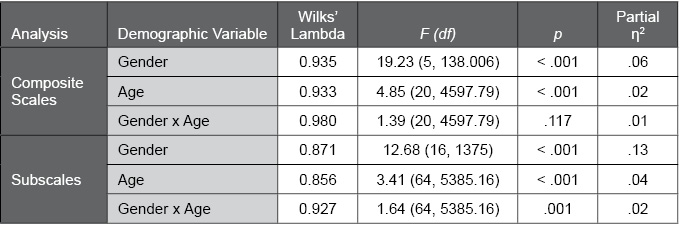
Table B.4. Effect Sizes for Gender and Age Effects in the EQ-i 2.0 Professional Norm Sample
The following table summarizes the effect sizes for gender, age, and the gender × age interaction on the EQ-i 2.0 Total EI score, composite scales, and subscales in the Professional Norm sample. Meaningful effect sizes (i.e., |d| ≥ .20, partial η2 ≥ .01) were found for several EQ-i 2.0 composite scales and subscales, suggesting differences among participants based on age and gender, and the need for separate age x gender norm groups.
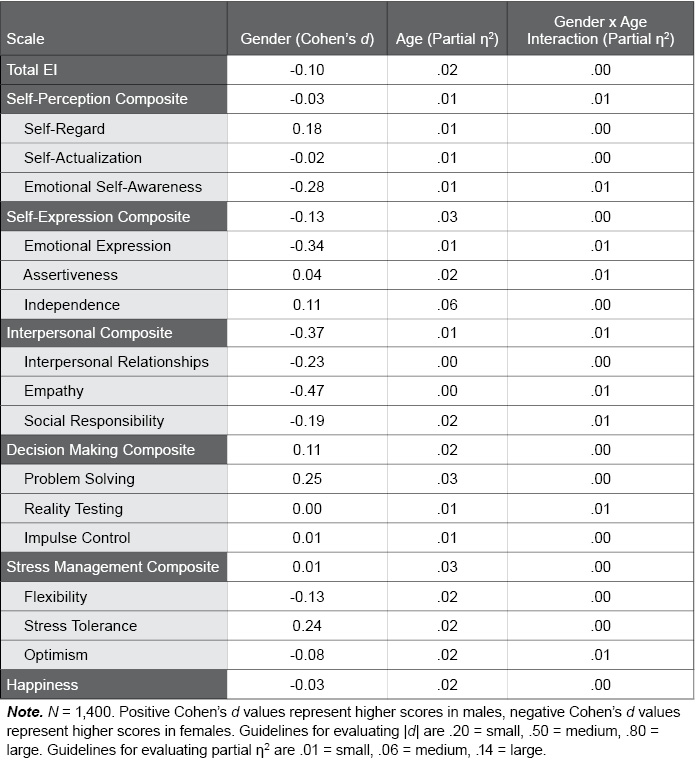
Table B.5. Gender Differences in EQ-i 2.0 Scores: Professional Norm Sample
The following table provides EQ-i 2.0 means and standard deviations for men and women in the Professional Norm sample. F and p values convey the statistical significance of gender differences. A p value lower than .01, which was found for many EQ-i 2.0 composite scales and subscales, suggests a significant difference between men and women.
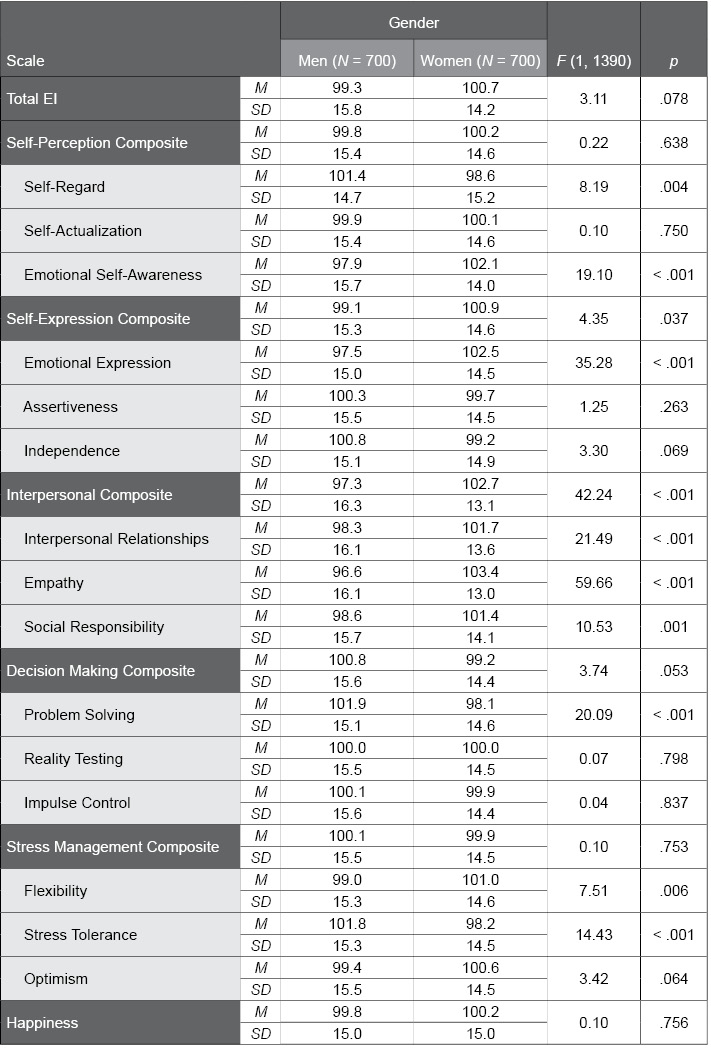
Table B.6. Age Differences in EQ-i 2.0 Scores: Professional Norm Sample
The following table provides means and standard deviations for the EQ-i 2.0 Total EI score, composite scales, and subscales for the various age groups in the EQ-i 2.0 Professional Norm sample. F and p values convey the statistical significance of age differences; p values lower than .01 were found for many EQ-i 2.0 composite scales and subscales, suggesting differences among the age groups.
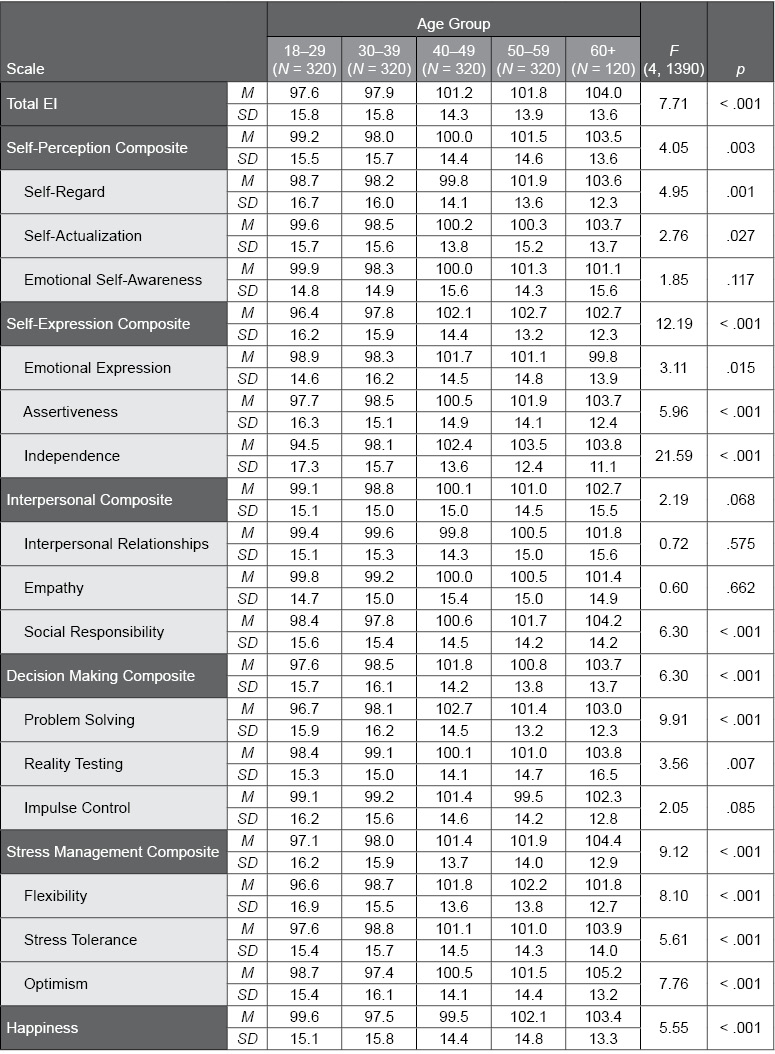
Table B.7. Internal Consistency: EQ-i 2.0 Professional Normative Sample
The following table summarizes the internal consistency (Cronbach’s alpha) values for the EQ-i 2.0 Total EI score, composite scales, and subscales in the EQ-i 2.0 Professional Norm groups. Alpha values range from 0.00 to 1.00. Higher values, like those found for this sample, provide evidence for strong reliability.
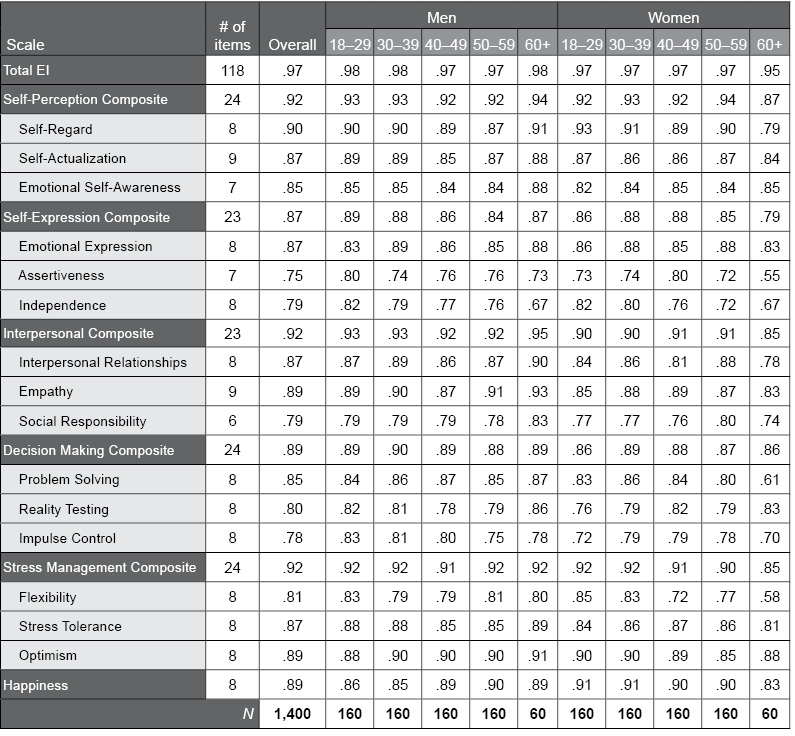
Table B.8. Comparison of Standard Scores from the General Population Norm Sample and Professional Norm Sample (Computed with General Population Norms)
The following table provides means and standard deviations of EQ-i 2.0 scores from the General Population Norm and Professional Norm samples. The differences between the two samples are provided. The magnitude and valence of these differences indicates higher mean scores in the Professional Norm sample.
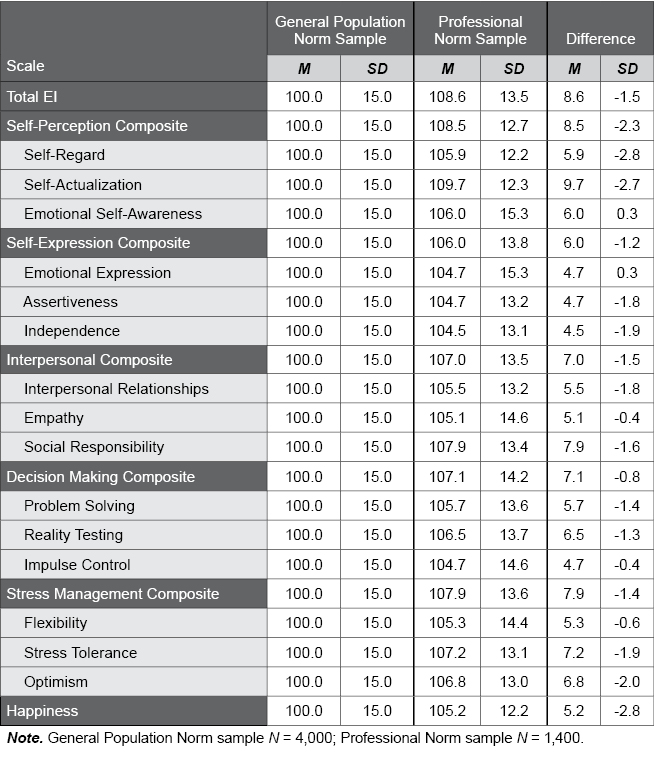
Table B.9. EQ-i 2.0 Customers Scored with Professional Norms
The following table provides means and standard deviations for EQ-i 2.0 scores in a customer sample (N = 4,000) when scored with the Professional Norms. Ms were all close to 100, and SDs were close to 15, indicating that the professional norms will produce scores that appropriately reflect typical EI skill among professionals.
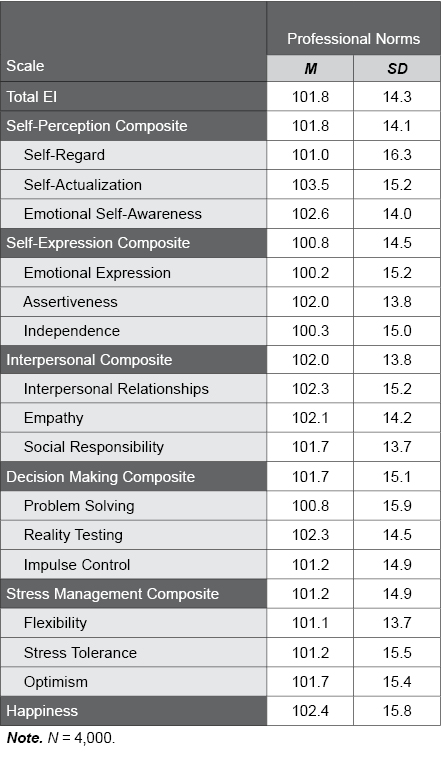
Figure B.1. Histogram of EQ-i 2.0 Total EI Standard Scores in the Customer Sample
This figure illustrates the distribution of EQ-i 2.0 Total EI scores in the customer sample (N = 4,000) when scored with the Professional Norms. Distributions that approximate a normal (“bell-shaped”) curve (as indicated by the black curved line), such as the one shown in this figure, suggest that the Total EI scores for the customer sample closely approximate a bell-shaped (Gaussian) distribution.
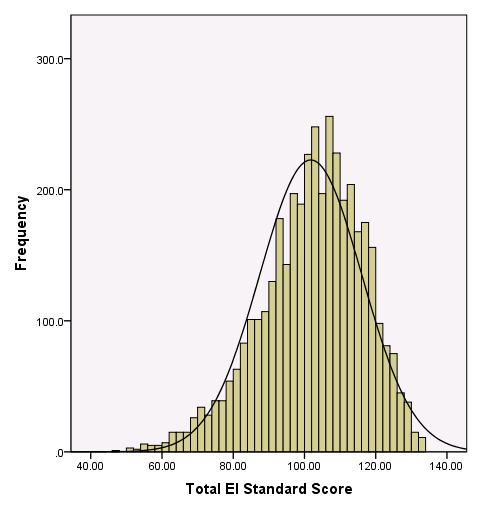
Table B.10. Correlations Among EQ-i 2.0 Composite Scales in the Professional Normative Sample
The following table illustrates the correlations among the EQ-i 2.0 composite scales in the Professional normative sample. The correlations seen here range from .51 to .78, with higher values suggesting the scales are interrelated and measure a common construct (i.e., emotional intelligence). Very high values (e.g., > .90) would suggest a unidimensional factor structure. The correlations found in the Professional normative sample support both the concept that the scales measure an underlying common construct, as well as the multidimensional factor structure of the EQ-i 2.0.
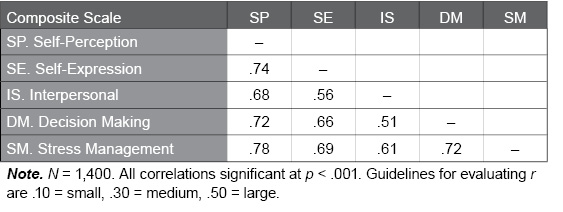
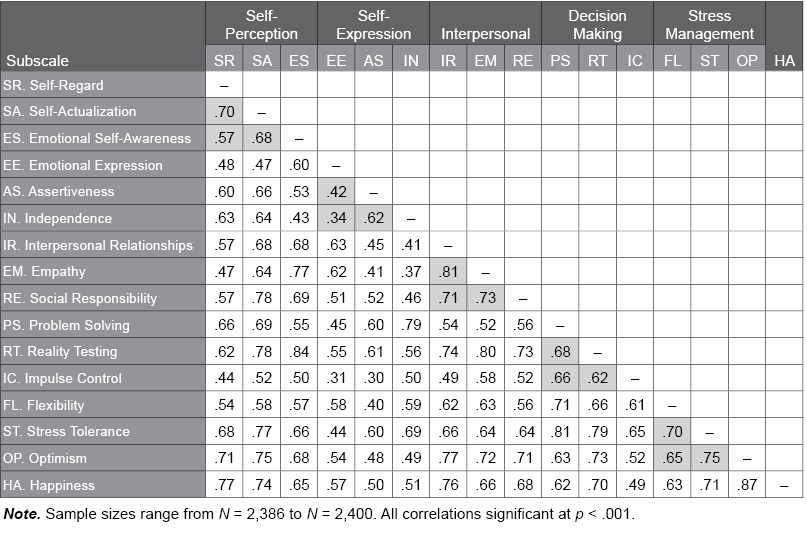
Table B.11. Correlations Among EQ-i 2.0 Subscales in the Professional Normative Sample
The following table illustrates the correlations among the EQ-i 2.0 subscales in the Professional normative sample. The correlations seen here range from .13 to .79, with higher values suggesting the scales share a relevant common psychological characteristic. Shaded cells indicate correlations between subscales within the same composite scale. Moderate to large correlations were found within the composite scales, supporting the multidimensional factor structure of the EQ-i 2.0.
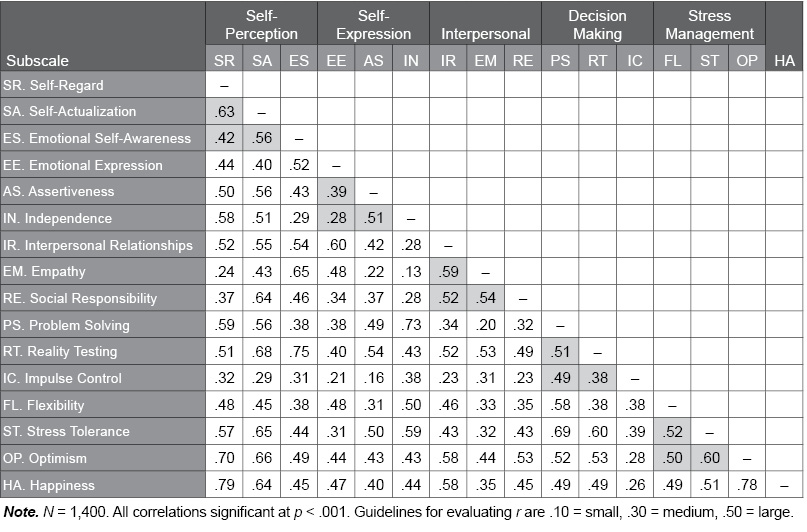
Table B.12. Length of Rater/Ratee Relationship in the EQ 360 2.0 Professional Normative Sample
The following table describes the length of relationship between raters and ratees in the EQ 360 2.0 Professional normative sample. The majority of raters (91.4%) indicated that they knew the ratee for at least one year.
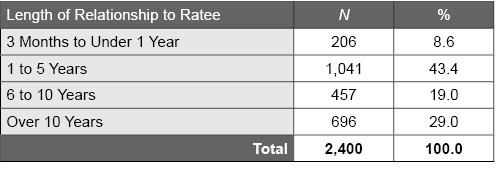
Table B.13. Frequency of Rater/Ratee Interactions in the EQ 360 2.0 Professional Normative Sample
The following table describes the frequency of interaction between raters and ratees in the EQ 360 2.0 Professional normative sample. Most raters (98.7%) indicated interaction with the ratee on a regular basis (i.e., at least monthly), which means the ratings are well-informed.
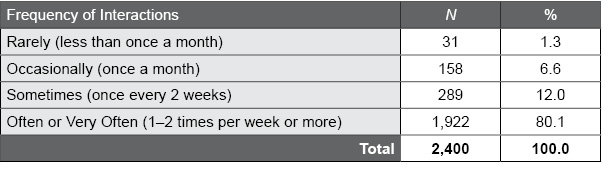
Table B.14. Ratee Age Group by Gender Distribution in the EQ 360 2.0 Professional Normative Sample
The following table describes the gender distribution of the EQ 360 2.0 Professional normative sample within age groups.
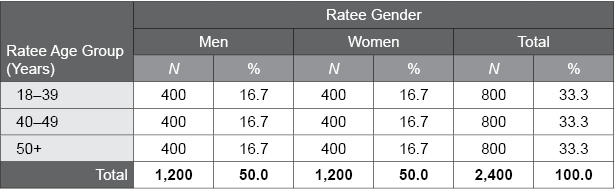
Table B.15. Distribution of Ratee Gender and Age Group by Rater Type in the EQ 360 2.0 Professional Normative Sample
The following table describes the gender and age group distribution of ratees in the EQ 360 2.0 Professional normative sample within each rater type.
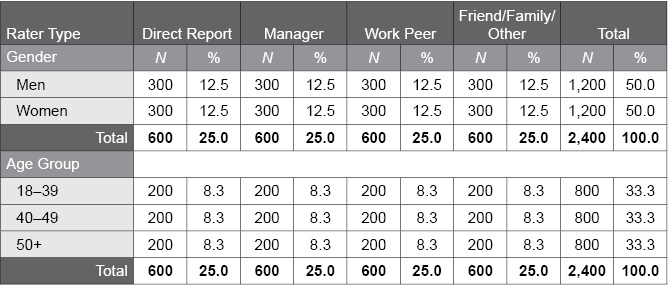
Table B.16. Employment Area Distribution of Ratees in the EQ 360 2.0 Professional Normative Sample
The following table summarizes the employment area distribution of the EQ 360 2.0 Professional normative sample. These proportions are similar to those found in the EQ-i 2.0 Professional normative sample.
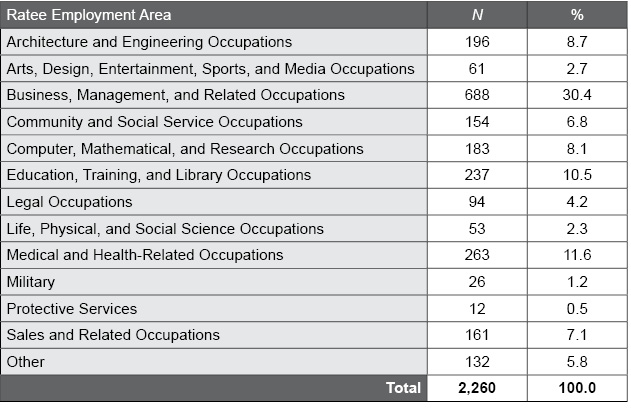
Table B.17. Effect Sizes for Gender, Age, and Rater Type Effects in the EQ 360 2.0 Professional Normative Sample
The following table summarizes the effect sizes for the effects of the ratee’s gender and age, as well as rater type on the EQ 360 2.0 Total EI score, composite scales, and subscales in the Professional normative sample. The d and partial η2 values found in the EQ 360 2.0 Professional normative sample suggest negligible or very small effects of the ratee’s gender, age, and rater type. This result means that there is no need to have separate EQ 360 2.0 Professional Norms based on gender, age, or rater type.
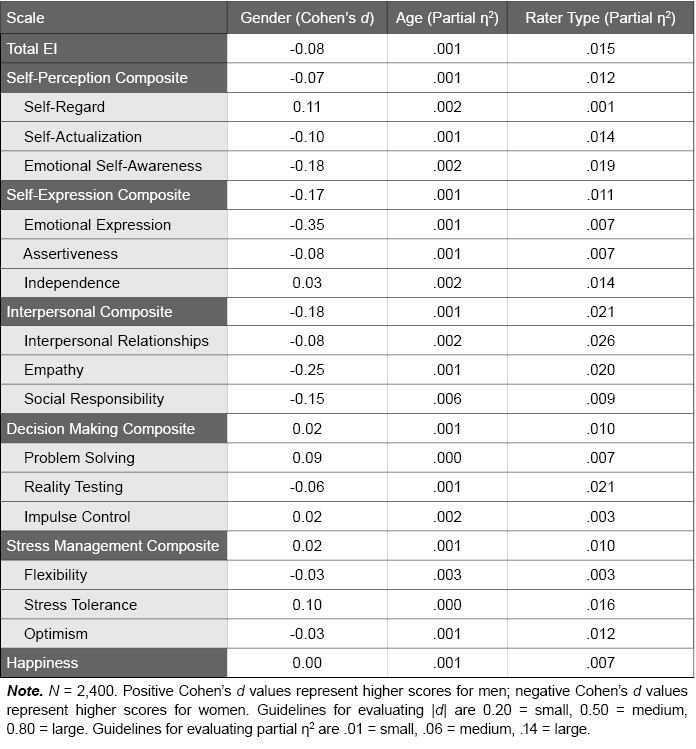
Table B.18. Gender Differences of Ratees in the EQ 360 2.0 Professional Normative Sample
The following table provides EQ 360 2.0 standard score scale means and standard deviations for men and women in the Professional normative sample. F and p values convey the statistical significance of gender differences; p values lower than .01 suggest significant differences between men and women.
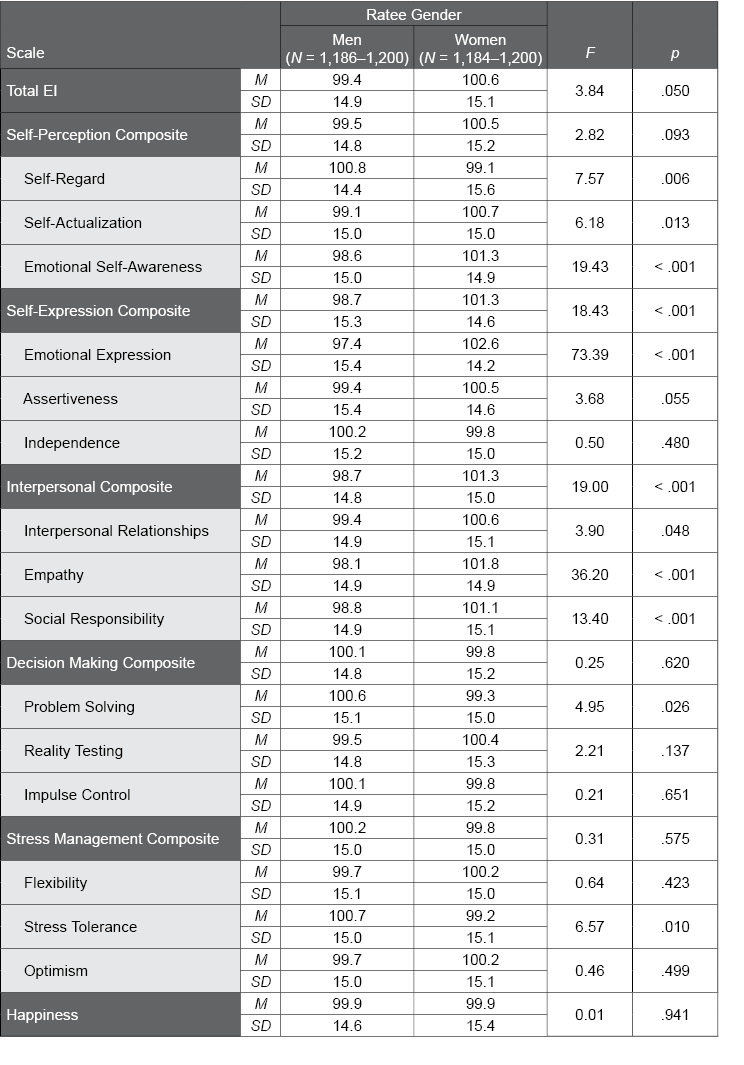
Table B.19. Ratee Age Differences in the EQ 360 2.0 Professional Norm Sample
The following table provides EQ 360 2.0 standard score scale means and standard deviations for the various ratee age groups in the Professional normative sample. F and p values convey the statistical significance of age group differences; p values lower than .01 suggest significant differences among age groups.
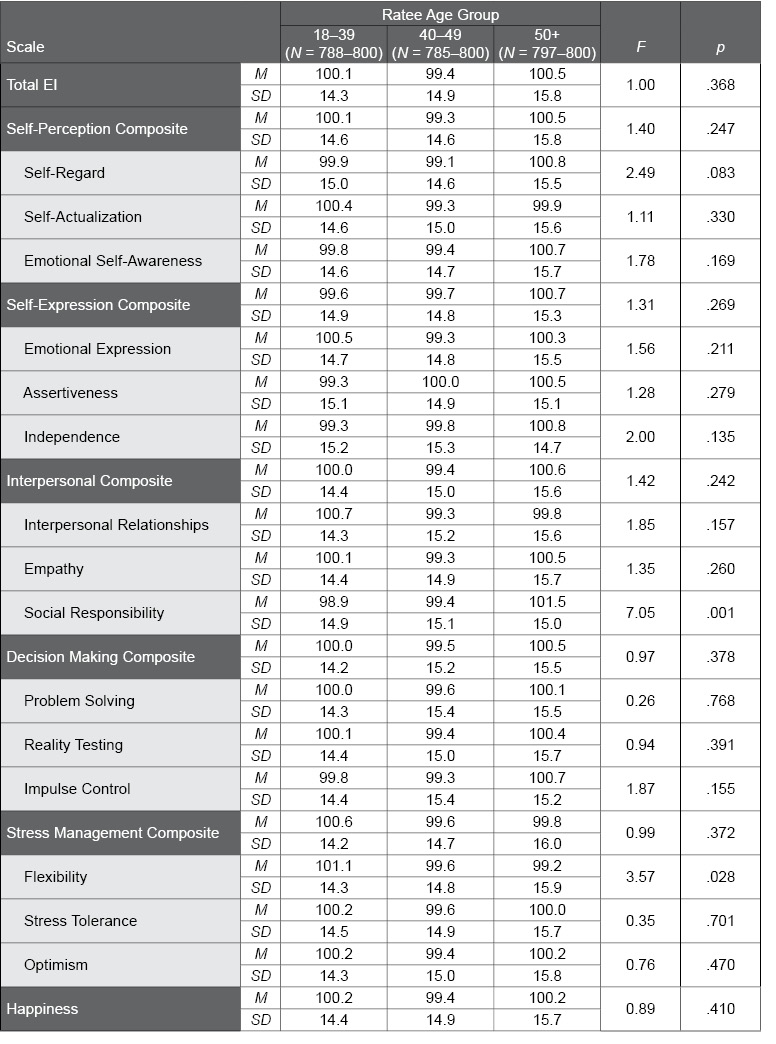
Table B.20. Rater Type Differences in the EQ 360 2.0 Professional Norm Sample
The following table provides EQ 360 2.0 standard score scale means and standard deviations for the various rater types in the Professional normative sample. F and p values convey the statistical significance of rater type group differences; p values lower than .01 were observed on most scales, suggesting significant differences between rater type groups.
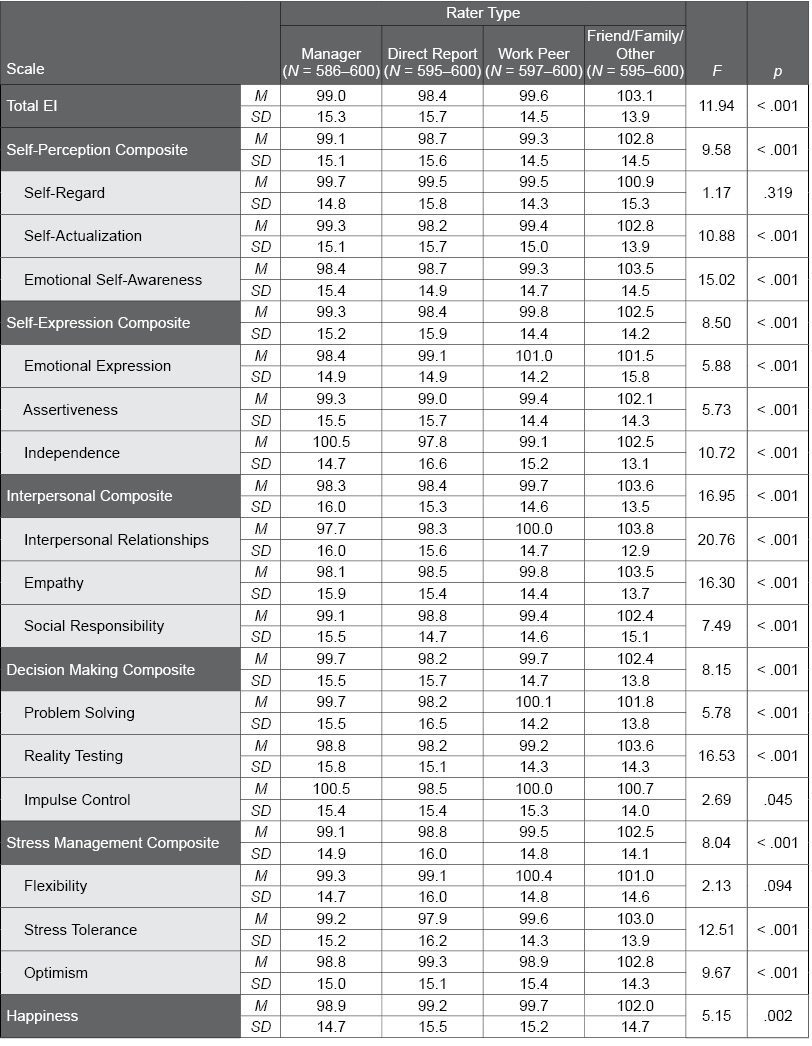
Figure B.2. Histogram of EQ 360 2.0 Total EI Standard Scores in the Professional Normative Sample
This figure illustrates the distribution of EQ 360 2.0 Total EI standard scores in the Professional normative sample. The distribution of the actual scores approximates the normal “bell-shaped” (Gaussian) curve (shown using the black curved line), which suggests that it is unnecessary to apply a normalizing transformation to the scores.
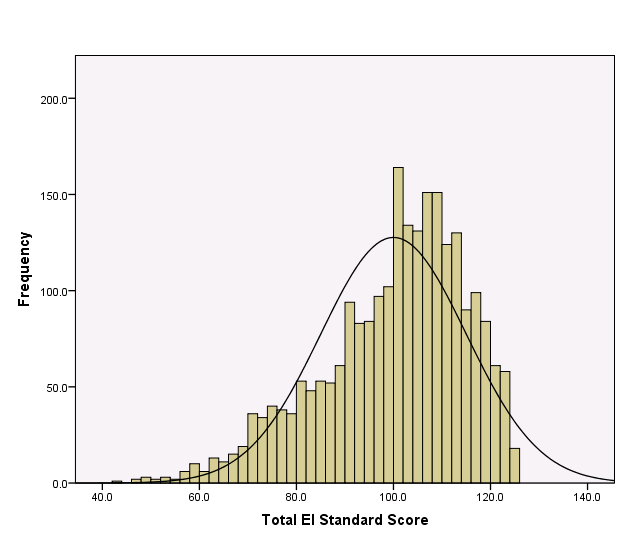
Table B.21. EQ 360 2.0 Professional Norm Sample Scored with EQ 360 2.0 General Population Norms
The following table provides EQ 360 2.0 standard score scale means and standard deviations for the North American Professional normative sample when scored with the North American EQ 360 2.0 General Population Norms, and compared against a mean of 100. Cohen’s d values provide an effect size to describe differences between the samples as small, medium, or large; t and p values provide statistical significance tests for these differences. The results indicate meaningful differences between EQ 360 2.0 scores obtained from the Professional normative sample and the General Population norms.
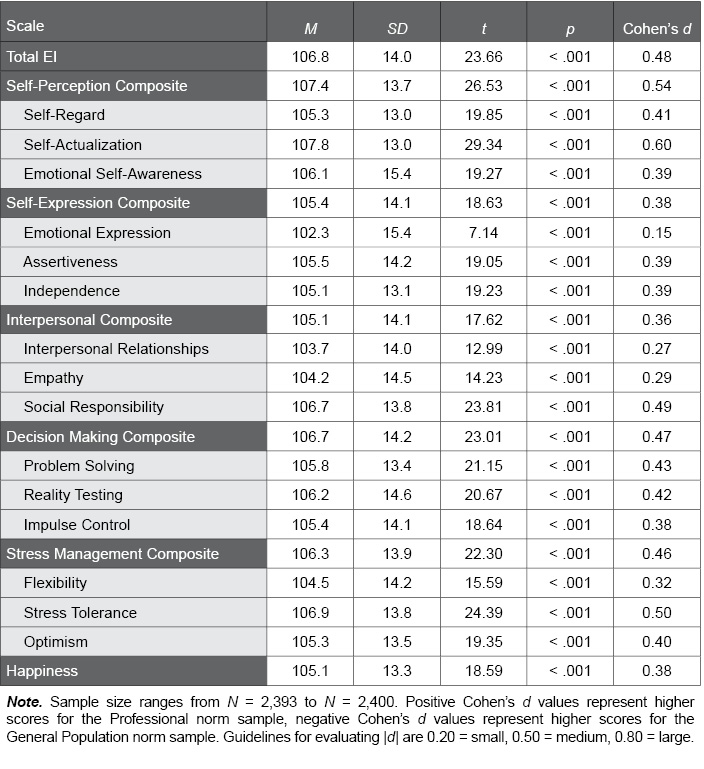
Table B.22. Internal Consistency of EQ 360 2.0 Scales in the Professional Normative Sample
The following table summarizes the internal consistency (Cronbach’s alpha) values for the EQ 360 2.0 scales in the Professional normative sample. Alpha values range from 0.00 to 1.00. Higher values provide evidence for the strong reliability of the EQ 360 2.0, as was found in the Professional normative sample.
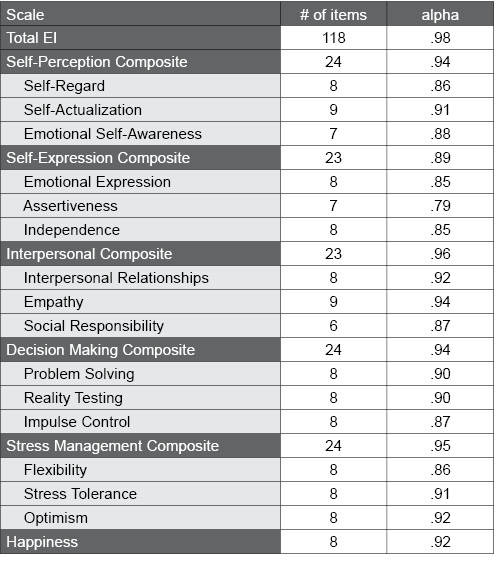
Table B.23. Correlations Among EQ 360 2.0 Composite Scales in the Professional Normative Sample
The following table illustrates the correlations among the EQ 360 2.0 composite scales in the Professional normative sample. The correlations seen here range from .67 to .87, with higher values suggesting the scales are interrelated and measure a common construct (i.e., emotional intelligence). Very high values (e.g., > .90) would suggest a unidimensional factor structure. The correlations found in the Professional normative sample support both the concept that the scales measure an underlying common construct, as well as the multidimensional factor structure of the EQ 360 2.0.
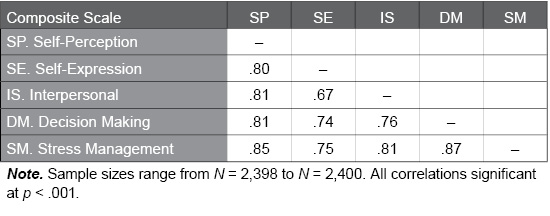
Table B.24. Correlations Among EQ 360 2.0 Subscales in the Professional Normative Sample
The following table illustrates the correlations among the EQ 360 2.0 subscales in the Professional normative sample. The correlations seen here range from .30 to .87, with higher values suggesting the scales share a relevant common psychological characteristic. Shaded cells indicate correlations between subscales within the same composite scale. Moderate to large correlations were found within the composite scales, supporting the multidimensional factor structure of the EQ 360 2.0.