


North American Professional Norms
Introduction
The release of the North American Professional Norms provides users with increased flexibility in the use of the EQ-i 2.0 and EQ 360 2.0, with the ability to score their clients against data collected from a sample of professionals in North America. This new feature was created based on rigorous science and with customer needs in mind. General Population norms have the widest scope and allow for comparisons to norms reflecting the average person in the North American population. Professional norms allow consultants the option of using a norm that is more relevant to the people they work with every day: working professionals. This chapter describes how these new norm groups were created to provide consultants with additional options to enrich their work, and provides normative and psychometric information particular to the professional population in North America. The EQ-i 2.0 and EQ 360 2.0 assessments remain unchanged, but additional normative samples are now available (the original North American normative samples are described in detail in Standardization, Reliability, and Validity; information about normative data from other countries is available in Additional Norms).
| This chapter describes the development of the EQ-i 2.0 and EQ 360 2.0 North American Professional Norms. For information on the EQ-i 2.0, including administration, interpretation, and development of the North American Norms, please refer to Parts I–V of the EQ-i 2.0 User’s Handbook. |
The first section of this chapter is devoted to the development, standardization, reliability, and validity of the North American EQ-i 2.0 Professional Norms. The second section describes the same properties for the North American EQ 360 2.0 Professional Norms.
The EQ-i 2.0 Professional Norm data were collected from 1,400 individuals, evenly proportioned by gender in each of five age intervals. Several small effects of gender and age were observed, leading to the creation of both overall norms, as well as age and gender specific norms. The Professional Norm sample scored higher than the General Population Norm sample across all scales. EQ-i 2.0 scores were found to be highly reliable in the North American Professional Norm sample, and the original EQ-i 2.0 factor structure was replicated with the North American EQ-i 2.0 Professional Norm data.
The EQ 360 2.0 Professional Norm data were collected from 2,400 raters, with an equal number of men and women in each of three age ranges (i.e., 18–39, 40–49, and 50+), for each of four rater types (i.e., manager, direct report, work peer, and family/friend/other). Respondents (“the raters”) were required to rate an individual (“the ratee”) on the EQ 360 2.0. Similar to results from other EQ 360 2.0 standardizations (i.e., North America General Population, Australia, United Kingdom, Ireland, and South Africa), negligible effects were found for ratee gender, age, and rater type. As a result, one overall norm group was created that collapses across all of these variables. The Professional ratees tended to be rated more highly than General Population ratees across all of the EQ 360 2.0 scales. Finally, EQ 360 2.0 scores were found to be highly reliable in the North American Professional Norm sample, and the original EQ 360 2.0 factor structure was replicated with the North American EQ 360 2.0 Professional Norm data.
In 2011, the EQ-i 2.0 was released with a General Population Norm, with a sample consisting of 4,000 people who closely represented the North American population at that point in time. In the same year, the EQ 360 2.0 was released with a North American General Population Norm sample (to determine the scores for each rater) consisting of 3,200 individuals. (Please refer to Standardization, Reliability, and Validity for more details about each normative sample.) This General Population Norm group is used to compare your client’s ratings to the average North American, and is representative of the age, gender, ethnicity, and education compositions of North America (in 2011). In essence, using the General Population Norm to compare your client’s ratings to the average person's ratings allows you to make the broadest comparison possible. This norm would include both working and non-working individuals, people with high and low education levels, etc.
Sometimes you or your client may want a more specific comparison. For instance, you may want to compare your client’s ratings to other similar individuals, such as other professionals. Each Professional Norm enables you to do just that; it allows you to compare your client’s ratings to ratings of professionals, rather than to individuals in the general population normative sample.
The Professional Norm does not replace the General Population Norm, but is another option you may select when generating your EQ-i 2.0 or EQ 360 2.0 reports.
The EQ-i 2.0 Professional Norm sample includes 1,400 individuals, the vast majority of whom are employed or self-employed and have at least some post-secondary education. The EQ 360 2.0 Professional Norm sample includes 2,400 individuals matching the same criteria. In other words, these norms reflect the individuals you will most commonly encounter in consultancy in professional contexts. (See Data Collection for the Professional Norm Sample in the Standardization sections below for more information on the Professional Norm sample.)
The Professional Norm sets the bar higher for your client’s ratings; this norm group is more educated and more representative of corporate and/or managerial employees than the General Population Norm.
If you are administering the EQ-i 2.0 or EQ 360 2.0 to an individual who you consider to be a professional, select the Professional Norm option. Selecting the Professional Norm option means that you are comparing your client’s score to other like individuals (professionals). Your client's work environment is likely made up of professionals, and he/she is likely to be gauged against other professionals when applying for jobs and promotions, as well as when considering development opportunities, and other career related opportunities.
EQ-i 2.0: Similar to the General Population Norm, there is both an Overall Professional Norm, and a Professional Norm that is broken down into Age and Gender Specific norm groups. If you use the Overall norm, the normative comparison will not be affected by the individual’s age or gender (for example, a 58-year-old male will be compared to all individuals in the Professional Norm sample regardless of their age or gender). If you use the Age and Gender Specific norm, then the comparison will be made only to professionals of the same gender and age group (for example, a 58-year-old male will only be compared to males who are 50–59 years of age). There are sound reasons for using either of these options, and the choice ultimately belongs with the preference of the test administrator. Some users prefer not to use the Age and Gender Specific norms because everyone is then scored against the same norm values. On the other hand, others like the specificity of comparing individuals directly to those that are most similar in terms of age and gender.
EQ 360 2.0: When you select the Professional Norm option, you can choose to score the ratee’s self-report against either the Overall norm or the Age and Gender norm. However, the raters will be automatically scored using the Overall norm.
Scoring a client’s or rater’s results with the Professional Norms will generally result in lower scores than those obtained using the General Population Norms. The decrease is not always the same from one subscale to the next and from one score to the next.
Example 1 illustrates the effect on scores of using the different norm options for Jeanine—a 37-year-old female Human Resources Specialist, based in New York. When Jeanine’s coach scored her EQ-i 2.0 results with the General Population Norms, many scores were in the High range (i.e., ≥ 110), including the Total EI score. This means that when Jeanine is compared to the general North American population, she has emotional intelligence that is higher than typical. In contrast, when Jeanine’s coach re-scored her EQ-i 2.0 results using the Professional Norms, her scores mostly fell in the Average range (her scores decreased by 4 to 8 points depending on the scale). This means that Jeanine’s emotional intelligence is fairly typical when compared to other professionals.
Example 1. Jeanine’s EQ-i 2.0 Scores Using General Population and Professional Norms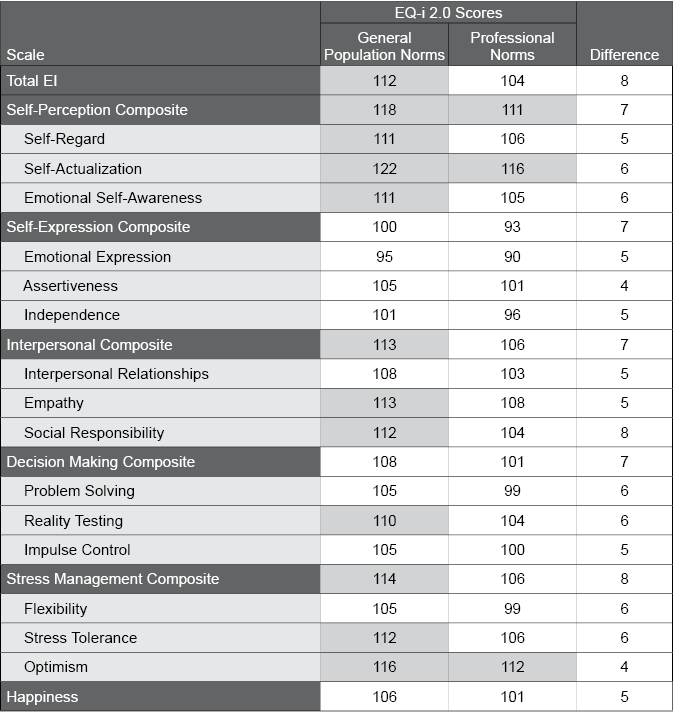
Note. Shaded cells indicate scores that fall in the High range.
Example 2 illustrates the effect on scores of using the different norm options. Sabrina, a Project Manager based in Toronto, was rated by her Manager, Michael. When Sabrina’s coach scored Michael’s ratings with the General Population 360 Norms, many ratings were in the High range (i.e., ≥ 110), including the Total EI score. This means that when Sabrina is compared to the general North American population, Michael rates her emotional intelligence as higher than typical. In contrast, when Sabrina’s coach re-scored her results using the Professional 360 Norms, Michael’s ratings mostly fell in the Average range (decreased by 2 to 9 points, depending on the scale). This means that Sabrina’s emotional intelligence, as viewed by her manager, is fairly typical when compared to other professionals.
Example 2. Michael’s Ratings for Sabrina’s EQ 360 2.0 Using General Population and Professional Norms
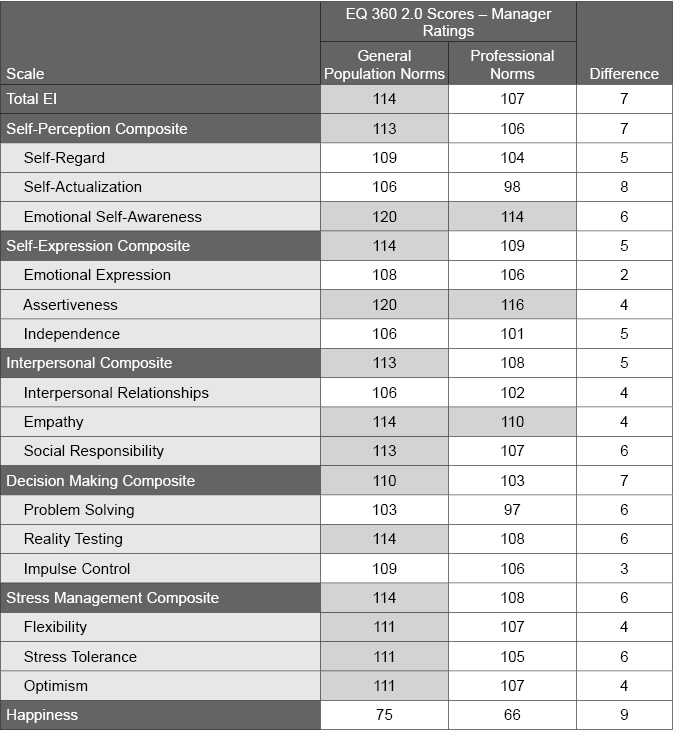
Note. Shaded cells indicate scores that fall in the High range.
This section describes the psychometric properties of the EQ-i 2.0 North American Professional Norms, including standardization, reliability, and validity information.
| All tables and figures representing detailed depictions of the analyses described in this chapter are available in Appendix B. |
Standardization is an important part of test development, because it involves the collection of normative data. This section describes the method of data collection and the breakdown of the normative samples, including the effects of age and gender on the EQ-i 2.0 results.
Data Collection for the Professional Norm Sample
Data collection for the Professional Norm sample took place over two phases. The first phase (Phase 1) of data collection took place from March, 2010 to December, 2010, as part of the full standardization process for the EQ-i 2.0. Data from Phase N = 700) comprises a subset of 571 professionals from the General Population Norm sample, as well as 129 leaders from a leadership validity study. The sample was selected from all regions in the United States and Canada, and also had good representation from various race/ethnicities (64.0% White, 15.7% Hispanic/Latino, 10.4% Black, 6.7% Asian, and 3.3% Other). This sample included only employed/self-employed professionals who had at least some post-secondary education (i.e., 15.0% had some college or university completed, 11.3% had a college diploma, 42.5% graduated from university with a bachelor’s degree, and 31.3% had a post-graduate or professional degree). The second phase (Phase 2) of data collection took place between July, 2011 and December, 2011. This sample (N = 700) included data from a randomly selected set of 700 employed/self-employed EQ-i 2.0 customers.
The total Professional Norm sample includes 1,400 individuals (N = 1,260 [90%] from the United States, and N = 140 [10%] from Canada). The sample includes an equal number of men and women, with a good spread across the age groups (see Table B.1 for the age x gender distribution of the sample; note that the 60+ group is smaller due to a higher proportion of retired individuals in this age group). The individuals in this sample were employed in a variety of professional occupations (see Table B.2 for a breakdown of employment areas).
Normative Phase
NORMING PROCEDURES
The first step in norm preparation was to determine if any trends existed in the data. For instance, large differences in scores between men and women, or across various age groups, could provide an argument for creating separate gender- or age-based norm groups. Conversely, a lack of such differences may dictate the use of a single norm group with gender and age groups combined. A series of analyses of covariance (ANCOVA; for Total EI) and multivariate analyses of covariance (MANCOVA; for the composites and subscales) was used to examine the relationships between gender and age with EQ-i 2.0 scores. Five age groups were used for this analysis: 18–29 years, 30–39 years, 40–49 years, 50–59 years, and 60+ years. In an attempt to control for Type I errors that might occur with multiple analyses, a more conservative criterion of p < .01 was used for all F-tests.
The Wilk’s lambda statistic generated from these analyses ranges from 0.00 to 1.00, and conveys the proportion of variance that is not explained by the effect (in this case, the interaction between gender and age) in the multivariate analyses. These values were all close to 1.00, suggesting that only a small amount of variance could be explained. However, F-tests revealed significant effects of gender and age for both the composite scale and subscale analyses, as well as a significant gender by age interaction for the subscales (see Table B.3). Given these results, the univariate effects are described in detail next.
AGE AND GENDER EFFECTS
Gender Effects. Results from the gender analyses showed that men and women did not differ significantly on the EQ-i 2.0 Total EI score, indicating that overall emotional intelligence (as measured by the EQ-i 2.0) is the same for men and women. However, small to medium gender effects were found for some composite scales and subscales (see Table B.4 for effect sizes and Table B.5 for descriptive statistics and significance test results). The largest difference was on Empathy; women scored higher than men with a moderate effect size (d = -0.47). Women also scored higher than men on the Interpersonal Composite (d = -0.37), Emotional Expression (d = -0.34), Emotional Self-Awareness (d = -0.28), and Interpersonal Relationships (d = -0.23). Finally, men scored higher than women with small effects on both Problem Solving (d = 0.25) and Stress Tolerance (d = 0.24). While there were several gender effects, it is important to note that overall gender effects were relatively small and represent only a few absolute standard score points.
Age Effects. Results of the age analyses revealed several small effects of age on EQ-i 2.0 scores (see Table B.4 for the effect sizes and Table B.6 for descriptive statistics and significance test results). Although the exact pattern of effects changes from scale to scale, there was a general tendency for scores to increase with age. More specifically, the lowest scores for the majority of the scales were found in the 18–29 or 30–39 year-old groups. Scores increased somewhat in the 40–49 and 50–59 year-old groups, and tended to increase again slightly in the 60+ group.
Gender × Age Interaction.There were no interactions between age and gender, and partial η2 values were all between 0.00 and 0.01 (see Table B.4); this indicates that age effects were consistent across males and females, and any gender effects were consistent across age groups.
NORM GROUPS AND NORM CONSTRUCTION
Overall, similar to what was found in the General Population Norm sample, the age and gender analyses revealed significant, but relatively small effects. Therefore, specific Age and Gender Professional Norms, as well as an Overall Professional Norm (i.e., collapsed across ages and genders) were both developed. Similar to results found in the General Population Norm sample, results from the Professional Norm sample revealed that skewness and kurtosis values were close to 0 (skewness values ranged from -0.86 to -0.24; kurtosis values ranged from -0.19 to 0.78) and did not reveal any significant departures from a bell-shaped (Gaussian) curve. Therefore, following the procedures used with the General Population Norm sample, artificial transformation of scores was deemed unnecessary. Actual construction of the norms was conducted in the same manner as the General Population Norms (see Standardization, Reliability, and Validity for more information on the construction of the General Population Norm).
Internal Consistency
Internal consistency conveys the degree to which a set of items are associated with one another. High levels of internal consistency suggest that the set of items are measuring a single, cohesive construct. Internal consistency is typically measured using Cronbach’s alpha (Cronbach, 1951). Cronbach’s alpha ranges from 0.0 to 1.0 and is a function of (a) the interrelatedness of the items that comprise a scale and (b) the number of items that comprise a scale (John & Benet-Martinez, 2000). Higher values reflect higher internal consistency.
Cronbach’s alpha values for the EQ-i 2.0 scales in the normative sample are presented in Table B.7. Given that Cronbach’s alpha is influenced by the number of items on a scale (with more items generally leading to higher alphas), the number of items per scale is also displayed in this table. The majority of the values found in Table B.7 demonstrate excellent reliability for the EQ-i 2.0. In the Overall column, the alpha value for the Total EI scale was .97, values for the composite scales ranged from .87 to .92, and values were .75 or higher for every subscale. These values were similar within the various age and gender normative groups, including a Total EI alpha of at least .95 in each norm group. The high level of internal consistency found in the EQ-i 2.0 Total EI score supports the idea that the EQ-i 2.0 items are measuring a single cohesive construct—namely, emotional intelligence.
Comparing the General Population and Professional Norms
Because the individuals in the Professional Norm sample have professional careers and are more educated as a group compared to those in the General Population Norm sample, it was hypothesized that the professionals should score higher than the general population. In order to test this hypothesis, EQ-i 2.0 scale scores for these two groups were compared to each other. As expected, the Professional Norm sample scored 4.5 to 9.7 standard score points higher (M difference = 6.4 standard score points) than the General Population Norm sample (see Table B.8).
Large Scale Analysis of Professional Norms
In order to determine what the distribution of scores from EQ-i 2.0 customers would look like when scored with the Professional Norms, data from a sample of 4,000 EQ-i 2.0 customers (collected from July, 2011 to December, 2011) were scored using the Professional Norms. Individuals in this sample came from both the United States (76.5%) and Canada (23.5%); 53.6% of the sample were male, and ranged in age from 18 to 80 years (M age = 40.8 years; SD = 12.4 years). Results from this sample (see Table B.9) revealed that when using the Professional Norms, the average scores were very close to 100 (M = 100.2 to 103.5), and the standard deviations were very close to 15 (SD = 13.7 to 16.3). Furthermore, skewness and kurtosis values for this sample were small (skewness values ranged from -0.95 to -0.34; kurtosis values ranged from -0.15 to 1.11) indicating that the distribution of scores approximates a bell-shaped (Gaussian) curve. These values, combined with an examination of the scale histograms, indicate a very slight negative skew, with no significant departures from a bell-shaped (Gaussian) curve (see Figure B.1).
Factorial Validity
EXPLORATORY FACTOR ANALYSIS
Exploratory factor analysis (EFA) was used to determine whether the subscales established with the North American EQ-i 2.0 General Population normative data empirically emerge from the Professional normative dataset. Five EFAs were conducted, where the items within each composite scale were analyzed separately. In each EFA, a three-factor solution was forced to examine whether the items that corresponded to each subscale within the composite also loaded together in the Professional normative data. Principal axis factoring extraction was used, with direct oblimin (i.e., oblique) rotation, as the factors within each composite are expected to correlate with each other. Reverse scoring was applied to relevant items prior to the analysis. Factor loadings were considered significant if they reached at least ± .30, and an item was defined as cross-loading if it was significant on more than one factor and had loadings within .10 of each other on these factors.
For the Self-Perception Composite EFA, items on the three subscales (Self-Regard, Self-Actualization, and Emotional Self-Awareness) loaded significantly onto their respective factors as expected by the established factor structure, with no cross-loading items.
For the Self-Expression Composite EFA, all items on the Emotional Expression, Assertiveness, and Independence subscales loaded onto their respective factors, with one Independence item that cross-loaded with Assertiveness.
For the Interpersonal Composite EFA, items on the Interpersonal Relationships, Empathy, and Social Responsibility subscales loaded significantly onto their respective factors, with no cross-loading items.
For the Decision Making Composite EFA, all Problem Solving, Reality Testing, and Impulse Control items loaded onto their respective factors, with the exception of one Reality Testing item that loaded onto Problem Solving.
For the Stress Management Composite EFA, all items on the three subscales (Flexibility, Stress Tolerance, and Optimism) loaded significantly onto their respective factors, with no cross-loading items.
To summarize, the EFAs generated solutions that strongly correspond to the established EQ-i 2.0 factor structure, with 117 out of 118 items empirically grouping together onto the expected factors.
CORRELATIONS AMONG EQ-i 2.0 COMPOSITE SCALES AND SUBSCALES
Correlations among the EQ-i 2.0 composite scales and subscales were examined. These correlations were expected to be generally high, given that they all measure the same underlying construct of emotional intelligence; however, they should not be so high as to indicate redundancy between the scales. Correlations observed in the Professional normative sample are presented in Tables B.10 (composite scales) and B.11 (subscales).
The composite scale correlations ranged from r = .51 (Decision Making/Interpersonal) to r = .78 (Stress Management/Self-Perception), with an average correlation of r = .67. For the subscales, correlations ranged from r = .13 (Independence/Empathy) to r = .79 (Self-Regard/Happiness), with an average correlation of r = .46. As highlighted in Table B.11, subscale correlations within composite scales ranged from r = .28 (Emotional Expression/Independence) to r = .63 (Self-Regard/Self-Actualization). These results support the notion that a single, underlying dimension is being represented in the EQ-i 2.0, yet the values are not overly high, and there is enough variation in the correlations to provide clear evidence of the multidimensional nature of the assessment, and support the existence of composite scales and subscales.
This section describes the psychometric properties of the EQ 360 2.0 North American Professional Norms, including standardization, reliability, and validity information.
| All tables and figures representing detailed depictions of the analyses described in this chapter are available in Appendix B. |
NORMATIVE SAMPLE
Data collection for the EQ 360 2.0 Professional Norm sample took place over two phases. Phase 1 took place from March, 2010 to May, 2010, as part of the full standardization process for the EQ 360 2.0. Data from Phase 1 comprises a subset of professional ratees (N = 1,200) from the EQ 360 2.0 General Population Norm sample. Phase 2 of data collection took place between January, 2013 and March, 2014. This sample included data from a randomly selected set of employed/self-employed EQ 360 2.0 customers (N = 1,200).
Respondents (“the raters”) were required to rate an individual (“the ratee”) on the EQ 360 2.0 and provide demographic information. Information was collected on each ratee’s gender, age group, geographic region, ethnicity, employment status, organizational level, education level, and occupation area. Information about the ratee (i.e., the person being rated) was provided by the rater (i.e., the person completing the assessment). Information was also collected about the type of relationship (i.e., manager, work peer, direct report, or family/friend/other), how long they have known each other, and how often they interact with each other. Note that some demographic information was not available for the Phase 2 customer data.
The EQ 360 2.0 Professional Norm sample includes 2,400 individuals from all regions of the United States (N = 2,147; 89.5%) and Canada (N = 253; 10.5%). The majority of raters knew the ratee for at least one year (91.4%; see Table B.12), and most of the raters indicated that they interacted with the ratee often or very often (80.1%; see Table B.13). The sample includes an equal number of men and women in each of three age ranges (i.e., 18–39, 40–49, and 50+), for each of the four rater types (i.e., manager, direct report, work peer, and family/friend/other). See Table B.14 for the age group by gender distribution of the sample, and Table B.15 for the distribution by rater type. The rated individuals in this sample were employed in a variety of professional occupations, with the largest proportions working in the areas of Business, Management, and Related occupations (30.4%), Medical and Health-Related occupations (11.6%), and Education, Training, and Library occupations (10.5%); see Table B.16 for a breakdown of employment areas. Additional information was available for the ratees in the first phase of data collection. Just over half of these ratees (51.3%) held positions at a management level within their organizations (7.4% Senior Executive, 9.1% Senior Manager, 34.8% Manager, 45.9% Non-Managerial Employee/Staff, and 2.9% Other). Most ratees had at least some post-secondary education (12.5% had some college or university completed, 13.2% had a trade certificate or college diploma, 40.4% had a university bachelor’s degree, and 28.4% had a post graduate or professional degree; 5.5% of raters indicated that they did not know the ratee’s education level). The sample had representation from various races/ethnicities (73.8% White, 10.2% Black, 7.1% Hispanic, 6.5% Asian, and 2.5% Native, Multiracial, or Other).
NORMING PROCEDURES
Similar to the EQ-i 2.0 Professional Norm, the first step in the EQ 360 2.0 Professional norming procedure was to determine if any demographic trends existed in the normative data. Large score differences between rater types (i.e., managers, work peers, direct reports, and family/friend/other) would suggest a need to create an option for separate rater type norm groups, while a lack of such differences would suggest a need to create a single norm option with the rater types combined. Similarly, large score differences between male and female ratees, or across various ratee age groups, would suggest a need to create an option for separate gender- or age-based norm groups. Conversely, a lack of such differences may dictate the use of a single norm group with genders and age groups combined.
A series of analyses of variance (ANOVA, for the Total EI score) and multiple analyses of variance (MANOVA, for the composites and subscales) were used to examine the relationships between EQ 360 2.0 scores and ratee gender, age, and rater type. To better control for Type I errors that might occur with multiple analyses, a more conservative criterion of p < .01 was used for all F-tests.
Gender Effects. Overall (and similar to results from the North American General Population EQ 360 2.0 data), gender effects were less pronounced in the EQ 360 2.0 Professional normative sample than they were in the EQ-i 2.0 Professional normative sample. Although there were some significant differences, the results showed that for most scales, there was no meaningful effect of gender; only Emotional Expression (d = -0.35) and Empathy (d = -0.25) reached a small effect size (women were rated slightly higher than men). In sum, gender effects were relatively small and represent only a few absolute standard score points. See Table B.17 for effect sizes and Table B.18 for descriptive statistics and significance test results.
Age Effects. Results showed that across all scales, there was no meaningful effect of age. Although a significant effect was observed across age groups for the Social Responsibility subscale, the minimum criteria for even a small effect was not reached. See Table B.17 for effect sizes and Table B.19 for descriptive statistics and significance test results.
Rater Type Effects. Although significant differences between rater types were observed on several scales, all effect sizes were small, and many did not reach the minimum criteria for a small effect size. The pattern that was typically observed was that slightly higher ratings were provided by the friend/family/other group. See Table B.17 for effect sizes and Table B.20 for descriptive statistics and significance test results.
Interaction Effects. No meaningful interaction effects were observed between Gender and Age, Gender and Rater Type, Age and Rater Type, or the three way interaction between these variables. Although significant Gender by Age effects were seen for a few scales, none of these reached the minimum criteria for even a small effect size.
Norm Groups and Norm Contstruction. Overall, the effect sizes (i.e., d and partial η2 values) found in the normative data suggest negligible or small effects of ratee gender and age. The scarcity of meaningful effects suggested that it was not necessary to create specific gender- or age-based norms for the EQ 360 Professional Norms. Although there were several small differences between rater types, these were not considered large enough to require specific rater-type norms, and on the whole it was preferable to be consistent with the norm options used for other EQ 360 2.0 releases. Therefore, only overall norms were developed. Accordingly, some sensitivity may be required in interpreting results obtained from different types of raters. For instance, ratings provided by friends/family/other might be expected to be higher than those obtained from other rater types.
These norms were created using the same procedure as the EQ-i 2.0 Professional Norms. Standard scores for all scales were computed with a mean of 100 and standard deviation of 15. Results revealed that skewness and kurtosis values were relatively small (skewness values ranged from -1.22 to -0.26, indicating a slight negative skew across scales; kurtosis values ranged from 0.00 to 1.37). Examination of the scale histograms did not reveal any significant departures from a bell-shaped (Gaussian) curve. Therefore, artificial transformation of scores to fit normal distributions was deemed unnecessary. A histogram for the EQ 360 2.0 Total EI score is provided in Figure B.2.
Comparison of Professional Norms to General Population Norms. The North American Professional Norm sample was compared against the North American General Population normative sample by computing standard scores for the EQ 360 2.0 scales with the General Population EQ 360 2.0 norms, and comparing these scores against a mean of 100. Significant differences were observed on all scales, and all but one scale (Emotional Expression) reached at least a small effect size (i.e., Cohen’s d ≥ 0.20). Mean differences ranged between 2.3 and 7.8 standard score points; on all scales, the Professional norm sample obtained higher scores compared to the General Population norms. The largest differences were observed on the following scales: Self-Actualization (d = 0.60), the Self-Perception composite (d = 0.54), Stress Tolerance (d = 0.50), Social Responsibility (d = 0.49), Total EI (d = 0.48), the Decision Making composite (d = 0.47), the Stress Management composite (d = 0.46), Problem Solving (d = 0.43), Reality Testing (d = 0.42), Self-Regard (d = 0.41), and Optimism (d = 0.40). The differences observed on the other scales were smaller in magnitude. Results are presented in Table B.21.
Internal Consistency
Internal consistency, a measure of reliability, conveys the degree to which a set of items are associated with one another. A high level of internal consistency suggests that the set of items are measuring a single, cohesive construct. Internal consistency is typically measured using Cronbach’s alpha (Cronbach, 1951). Cronbach’s alpha ranges from 0.0 to 1.0 and is a function of both the interrelatedness of the items in a test or scale and the length of the test (John & Benet-Martinez, 2000). Higher values reflect higher internal consistency. Although there is no universal criterion for a good alpha level, informal cut-offs for evaluating alpha are typically .90 is “excellent,” .80 is “good,” .70 is “acceptable,” and lower than .70 is “questionable.”
Cronbach’s alpha values for the EQ 360 2.0 scales for the Professional Norm sample are presented in Table B.22. These values demonstrate good to excellent reliability, and are particularly favorable given the small number of items included in most subscales. The alpha value of the Total EI scale was .98, values for the composite scales ranged from .89 to .96, and values for the subscales ranged from .79 to .94.
The high level of internal consistency found in the Total EI score supports the idea that the EQ 360 2.0 items are measuring a single, cohesive construct, namely emotional intelligence. The same can be said of the individual components of emotional intelligence that make up the EQ-i 2.0 (i.e., the composite scales and subscales).
Factorial Validity
EXPLORATORY FACTOR ANALYSIS
Exploratory factor analysis (EFA) was used to determine whether the subscales established with the North American EQ 360 2.0 General Population normative data empirically emerge from the Professional normative dataset. Five EFAs were conducted, where the items within each composite scale were analyzed separately. In each EFA, a three-factor solution was forced to examine whether the items that corresponded to each subscale within the composite also loaded together in the Professional normative data. Principal axis factoring extraction was used, with direct oblimin (i.e., oblique) rotation, as the factors within each composite are expected to correlate with each other. Reverse scoring was applied to relevant items prior to the analysis. Factor loadings were considered significant if they reached at least ± .30, and an item was defined as cross-loading if it was significant on more than one factor and had loadings within .10 of each other on these factors.
For the Self-Perception Composite EFA, items on the three subscales (Self-Regard, Self-Actualization, and Emotional Self-Awareness) loaded significantly onto their respective factors as expected by the established factor structure, with no cross-loading items.
For the Self-Expression Composite EFA, all items on the Emotional Expression, Assertiveness, and Independence subscales loaded onto their respective factors, with the exception of one Assertiveness item that fell a bit below the cut-off with a factor loading of .25.
For the Interpersonal Composite EFA, most items on the Interpersonal Relationships, Empathy, and Social Responsibility subscales loaded onto their respective factors, with the exception of two Interpersonal Relationships items that loaded onto Empathy.
For the Decision Making Composite EFA, all Problem Solving, Reality Testing, and Impulse Control items loaded onto their respective factors, with one Problem Solving item that cross-loaded with Impulse Control, and one Reality Testing item that cross-loaded with Problem Solving.
For the Stress Management Composite EFA, most items on the Flexibility, Stress Tolerance, and Optimism subscales loaded significantly onto their respective factors. One Stress Tolerance item fell just below the cut-off with a factor loading of .29, and two other Stress Tolerance items cross-loaded—one each with Optimism and Flexibility.
To summarize, the EFAs generated solutions that strongly correspond to the established EQ 360 2.0 factor structure, with 114 out of 118 items empirically grouping together onto the expected factors.
CORRELATIONS AMONG EQ 360 2.0 COMPOSITE SCALES AND SUBSCALES
Correlations among the EQ 360 2.0 composite scales and subscales were examined. These correlations were expected to be generally high, given that they all measure the same underlying construct of emotional intelligence; however, they should not be so high as to indicate redundancy between the scales. Correlations observed in the Professional normative sample are presented in Tables B.23 (composite scales) and B.24 (subscales).
The composite scale correlations ranged from r = .67 (Self-Expression/Interpersonal) to r = .87 (Stress Management/Decision Making), with an average correlation of r = .79. For the subscales, correlations ranged from r = .30 (Impulse Control/Assertiveness) to r = .87 (Optimism/Happiness), with an average correlation of r = .61. As highlighted in Table B.24, subscale correlations within composite scales ranged from r = .34 (Emotional Expression/Independence) to r = .81 (Interpersonal Relationships/Empathy). These results support the notion that a single, underlying dimension is being represented in the EQ 360 2.0, yet the values are not overly high, and there is enough variation in the correlations to provide clear evidence of the multidimensional nature of the assessment, and support the existence of composite scales and subscales.