Appendix B: EQ-i® 2.0 North American Professional Norms
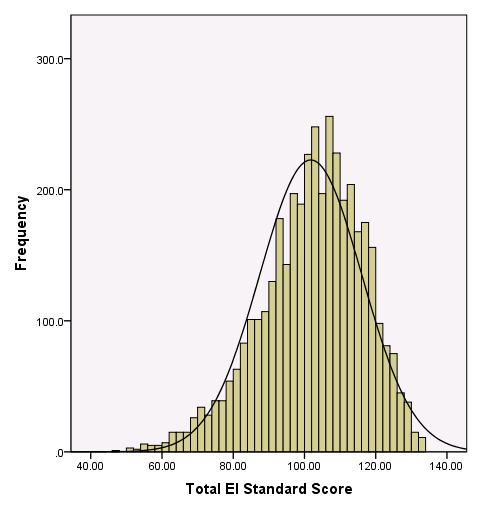
Figure B.1. Histogram of EQ-i 2.0 Total EI Standard Scores in the Customer Sample
This figure illustrates the distribution of EQ-i 2.0 Total EI scores in the customer sample (N = 4,000) when scored with the Professional Norms. Distributions that approximate a normal (“bell-shaped”) curve (as indicated by the black curved line), such as the one shown in this figure, suggest that the Total EI scores for the customer sample closely approximate a bell-shaped (Gaussian) distribution.