Appendix B: EQ-i® 2.0 North American Professional Norms
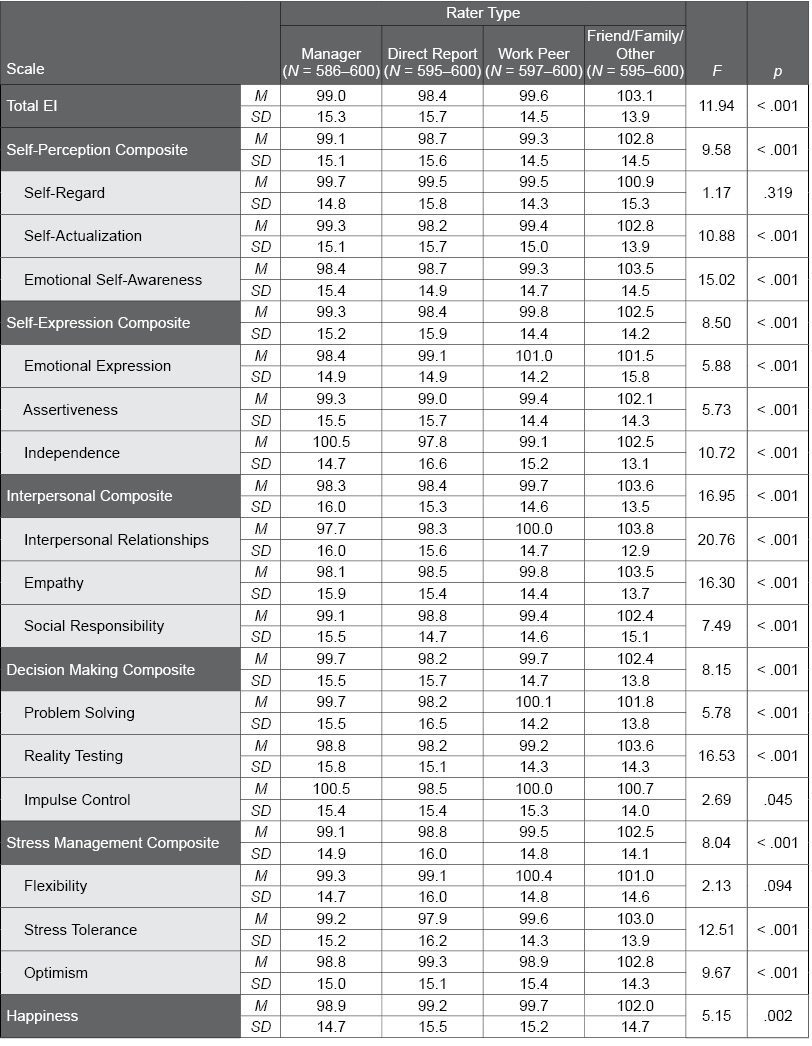
Table B.20. Rater Type Differences in the EQ 360 2.0 Professional Norm Sample
The following table provides EQ 360 2.0 standard score scale means and standard deviations for the various rater types in the Professional normative sample. F and p values convey the statistical significance of rater type group differences; p values lower than .01 were observed on most scales, suggesting significant differences between rater type groups.