Appendix B: EQ-i® 2.0 North American Professional Norms
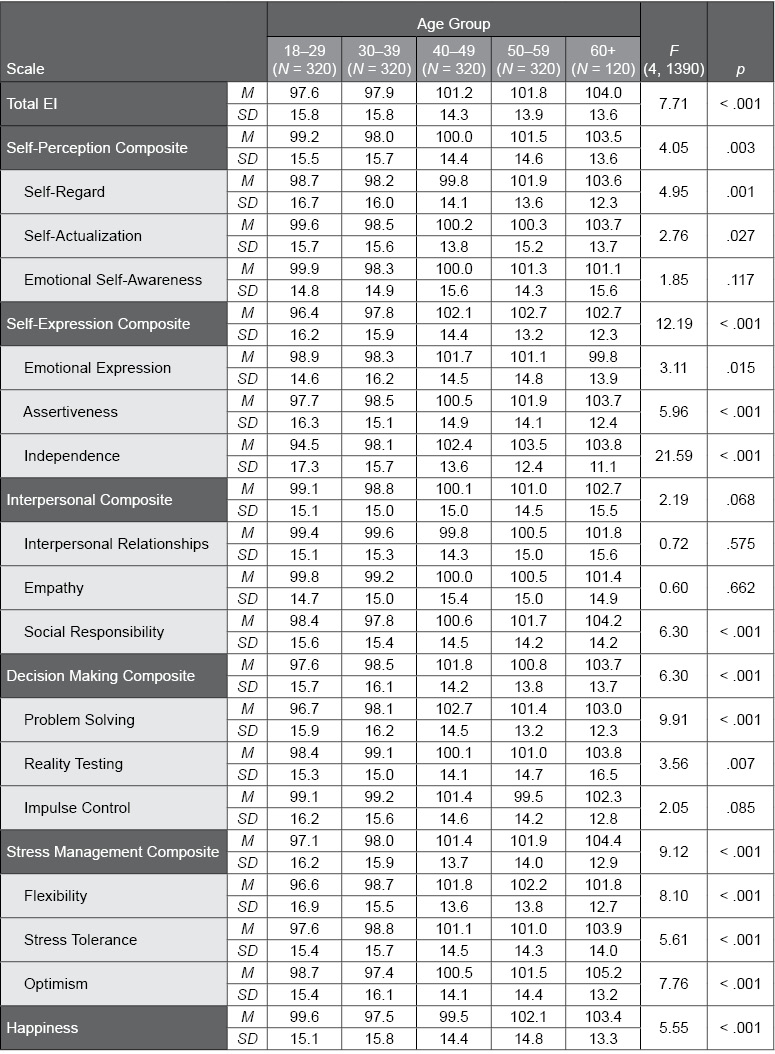
Table B.6. Age Differences in EQ-i 2.0 Scores: Professional Norm Sample
The following table provides means and standard deviations for the EQ-i 2.0 Total EI score, composite scales, and subscales for the various age groups in the EQ-i 2.0 Professional Norm sample. F and p values convey the statistical significance of age differences; p values lower than .01 were found for many EQ-i 2.0 composite scales and subscales, suggesting differences among the age groups.