Appendix B: EQ-i® 2.0 North American Professional Norms
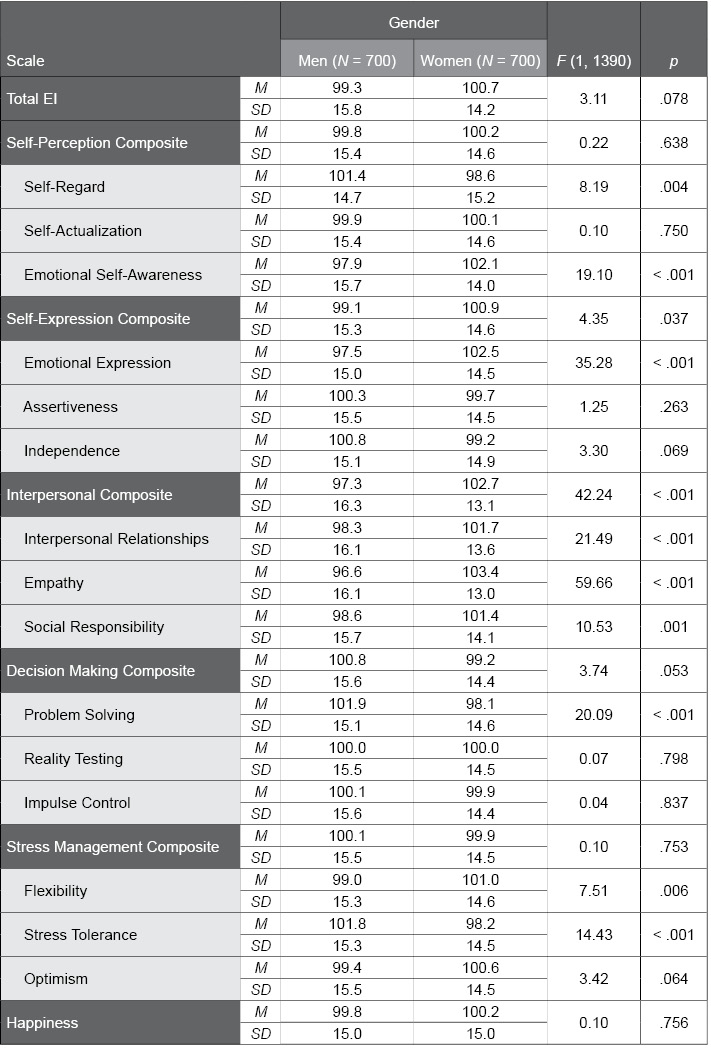
Table B.5. Gender Differences in EQ-i 2.0 Scores: Professional Norm Sample
The following table provides EQ-i 2.0 means and standard deviations for men and women in the Professional Norm sample. F and p values convey the statistical significance of gender differences. A p value lower than .01, which was found for many EQ-i 2.0 composite scales and subscales, suggests a significant difference between men and women.