Appendix B: EQ-i® 2.0 North American Professional Norms
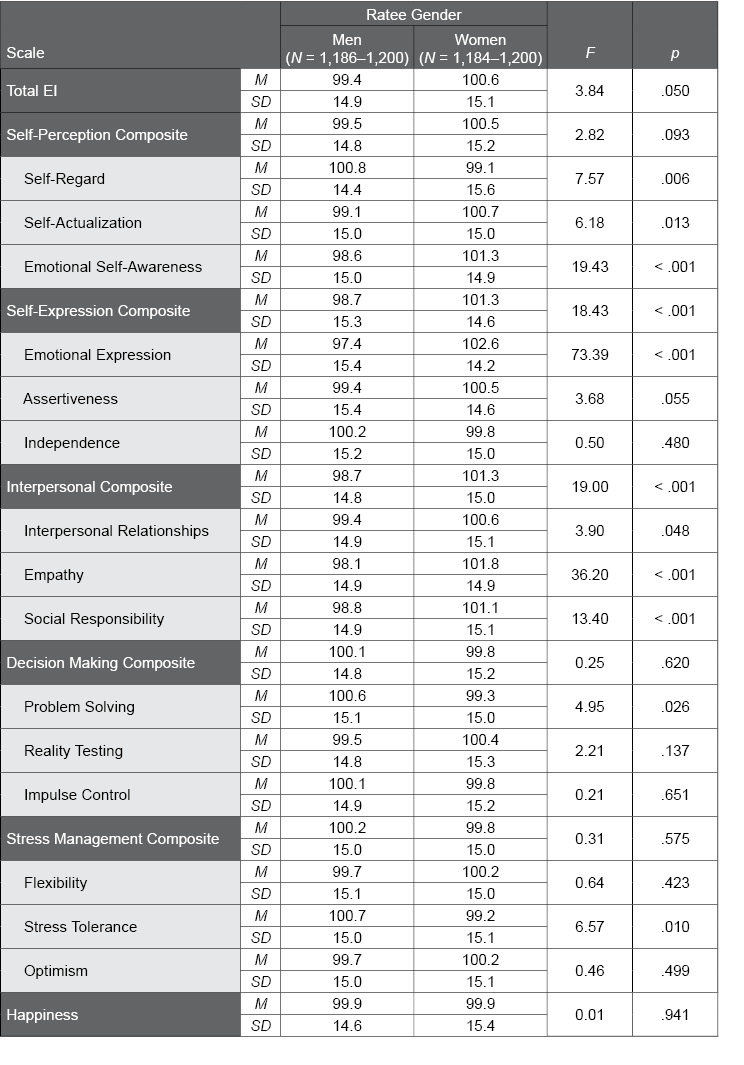
Table B.18. Gender Differences of Ratees in the EQ 360 2.0 Professional Normative Sample
The following table provides EQ 360 2.0 standard score scale means and standard deviations for men and women in the Professional normative sample. F and p values convey the statistical significance of gender differences; p values lower than .01 suggest significant differences between men and women.