Appendix B: EQ-i® 2.0 North American Professional Norms
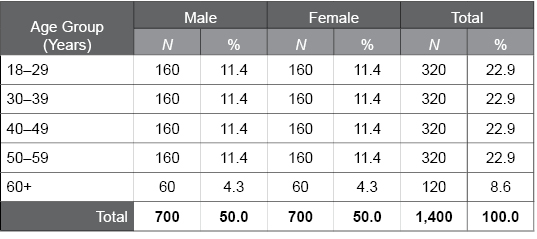
Table B.1. Age x Gender Distribution of the EQ-i 2.0 Professional Norm Sample
The following table conveys the distribution of participants in the EQ-i 2.0 Professional Norm sample, categorized by age group and gender. An ideal distribution is one that is similarly proportioned across all groups. The EQ-i 2.0 Professional Norm sample represents an ideal distribution because it demonstrates equal representation of all age × gender groups, until age 60+ where there are fewer cases (due to retirements).