


Appendix I. EQ-i 2.0 Swedish Norms
This appendix presents the statistical results pertaining to the development of the EQ-i 2.0 Swedish Norms.
- Table I.1. Age × Gender Distribution of the EQ-i 2.0 Swedish Normative Sample
- Table I.2. Geographic Distribution of the EQ-i 2.0 Swedish Normative Sample by Region
- Table I.3. Geographic Distribution of the EQ-i 2.0 Swedish Normative Sample by Province
- Table I.4. Education Level Distribution of the EQ-i 2.0 Swedish Normative Sample
- Table I.5. Employment Status Distribution of the EQ-i 2.0 Swedish Normative Sample
- Table I.6. Occupation Area Distribution of the EQ-i 2.0 Swedish Normative Sample
- Table I.7. Organizational Level Distribution of the EQ-i 2.0 Swedish Normative Sample
- Table I.8. Effect Sizes for Gender and Age Effects in the EQ-i 2.0 Swedish Normative Sample
- Table I.9. Gender Differences in the EQ-i 2.0 Swedish Normative Sample
- Table I.10. Age Group Differences in the EQ-i 2.0 Swedish Normative Sample
- Figure I.1. Histogram of EQ-i 2.0 Total EI Standard Scores in the Swedish Normative Sample
- Table I.11. Internal Consistency of EQ-i 2.0 Scales in the Swedish Normative Sample
- Table I.12. Correlations Among EQ-i 2.0 Composite Scales in the Swedish Normative Sample
- Table I.13. Correlations Among EQ-i 2.0 Subscales in the Swedish Normative Sample
- Table I.14. Length of Rater/Ratee Relationship in the EQ 360 2.0 Swedish Normative Sample
- Table I.15. Strength of Rater/Ratee Relationship in the EQ 360 2.0 Swedish Normative Sample
- Table I.16. Frequency of Rater/Ratee Interactions in the EQ 360 2.0 Swedish Normative Sample
- Table I.17. Ratee Age Group by Gender Distribution in the EQ 360 2.0 Swedish Normative Sample
- Table I.18. Ratee Gender by Rater Type Distribution in the EQ 360 2.0 Swedish Normative Sample
- Table I.19. Ratee Age Group by Rater Type Distribution in the EQ 360 2.0 Swedish Normative Sample
- Table I.20. Geographic Distribution of the EQ 360 2.0 Swedish Normative Sample by Region
- Table I.21. Geographic Distribution of the EQ 360 2.0 Swedish Normative Sample by Province
- Table I.22. Education Level Distribution of Ratees in the EQ 360 2.0 Swedish Normative Sample
- Table I.23. Employment Status Distribution of Ratees in the EQ 360 2.0 Swedish Normative Sample
- Table I.24. Occupation Area Distribution of Ratees in the EQ 360 2.0 Swedish Normative Sample
- Table I.25. Organizational Level Distribution of the EQ 360 2.0 Swedish Normative Sample
- Table I.26. Effect Sizes for Gender, Age, and Rater Type Effects in the EQ 360 2.0 Swedish Normative Sample
- Table I.27. Gender Differences of Ratees in the EQ 360 2.0 Swedish Normative Sample
- Table I.28. Ratee Age Differences in the EQ 360 2.0 Swedish Normative Sample
- Table I.29. Rater Type Differences in the EQ 360 2.0 Swedish Normative Sample
- Figure I.2. Histogram of EQ 360 2.0 Total EI Standard Scores in the Swedish Normative Sample
- Table I.30. Internal Consistency of EQ 360 2.0 Scales in the Swedish Normative Sample
- Table I.31. Correlations Among EQ 360 2.0 Composite Scales in the Swedish Normative Sample
- Table I.32. Correlations Among EQ 360 2.0 Subscales in the Swedish Normative Sample
Table I.1. Age × Gender Distribution of the EQ-i 2.0 Swedish Normative Sample
The following table presents the distribution of the EQ-i 2.0 Swedish normative sample, categorized by age group and gender. An equal number of men and women were sampled at each age group.
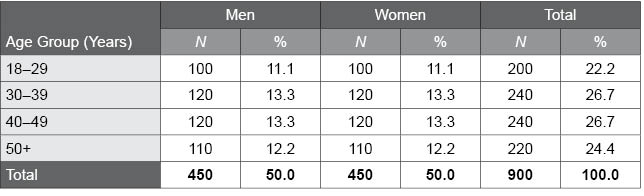
Table I.2. Geographic Distribution of the EQ-i 2.0 Swedish Normative Sample by Region
The following table presents the geographic distribution for the EQ-i 2.0 Swedish normative sample by region.
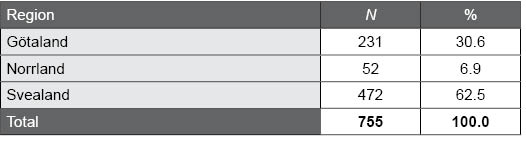
Table I.3. Geographic Distribution of the EQ-i 2.0 Swedish Normative Sample by Province
The following table presents the geographic distribution for the EQ-i 2.0 Swedish normative sample by province.
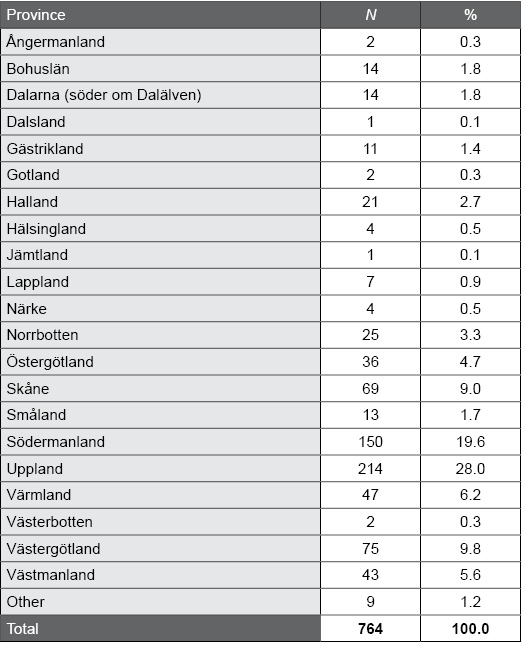
Table I.4. Education Level Distribution of the EQ-i 2.0 Swedish Normative Sample
The following table summarizes the education level distribution of the EQ-i 2.0 Swedish normative sample.
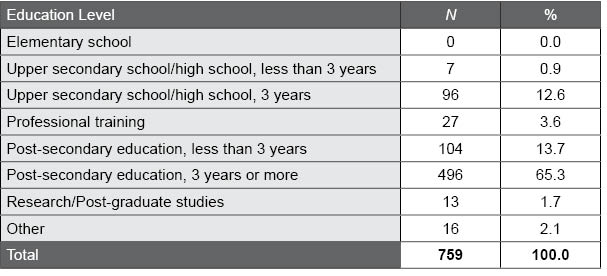
Table I.5. Employment Status Distribution of the EQ-i 2.0 Swedish Normative Sample
The following table summarizes the employment status distribution of the EQ-i 2.0 Swedish normative sample.
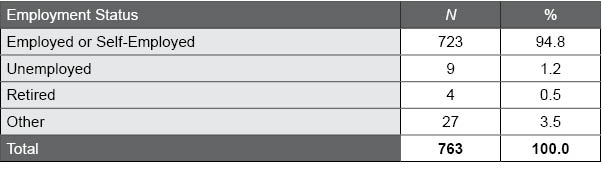
Table I.6. Occupation Area Distribution of the EQ-i 2.0 Swedish Normative Sample
The following table summarizes the occupation area distribution of the EQ-i 2.0 Swedish normative sample.
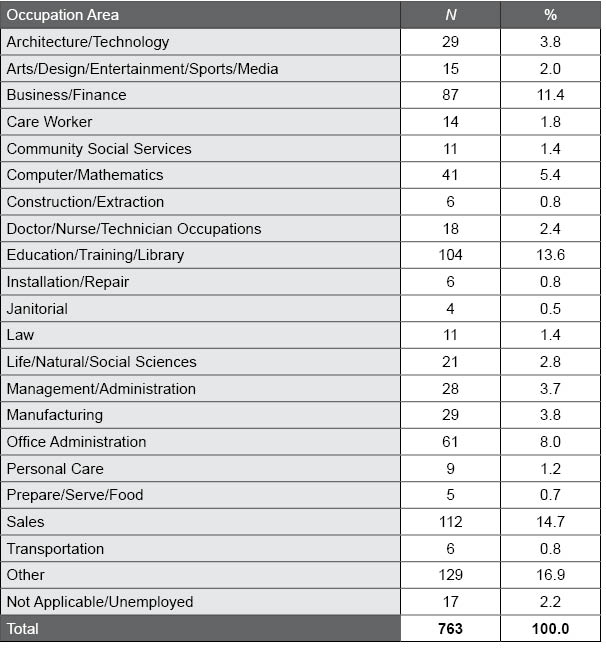
Table I.7. Organizational Level Distribution of the EQ-i 2.0 Swedish Normative Sample
The following table summarizes the organizational level distribution of the EQ-i 2.0 Swedish normative sample.
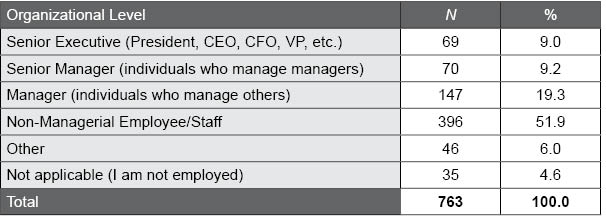
Table I.8. Effect Sizes for Gender and Age Effects in the EQ-i 2.0 Swedish Normative Sample
The following table summarizes the effect sizes for the effects of gender and age on the EQ-i 2.0 Total EI score, composite scales, and subscales in the Swedish normative sample. Meaningful effect sizes (i.e., |d| ≥ 0.20, partial η2 ≥ .01) suggest differences among participants based on the demographic variable.
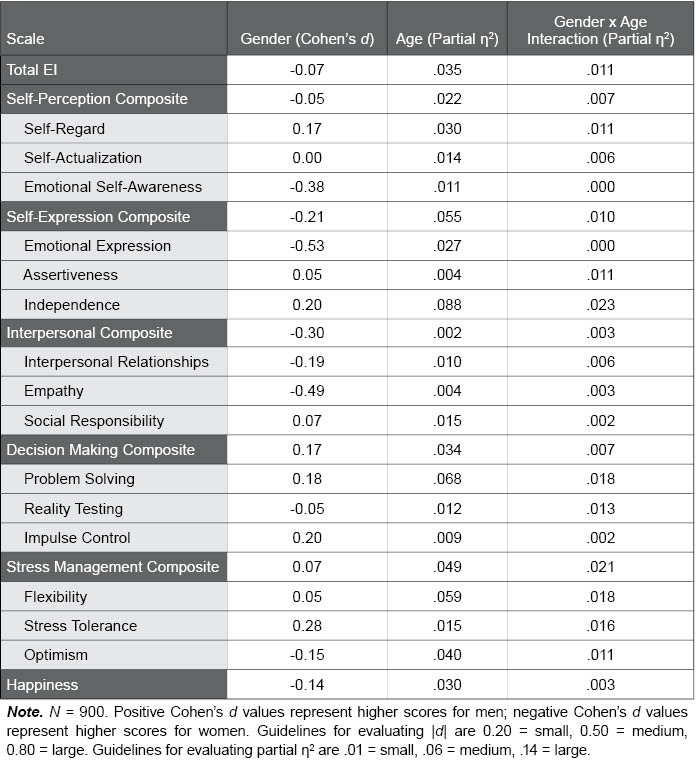
Table I.9. Gender Differences in the EQ-i 2.0 Swedish Normative Sample
The following table provides EQ-i 2.0 standard score scale means and standard deviations for men and women in the Swedish normative sample. F and p values convey the statistical significance of gender differences; p values lower than .01, which were found for several scales, indicate significant differences between men and women.
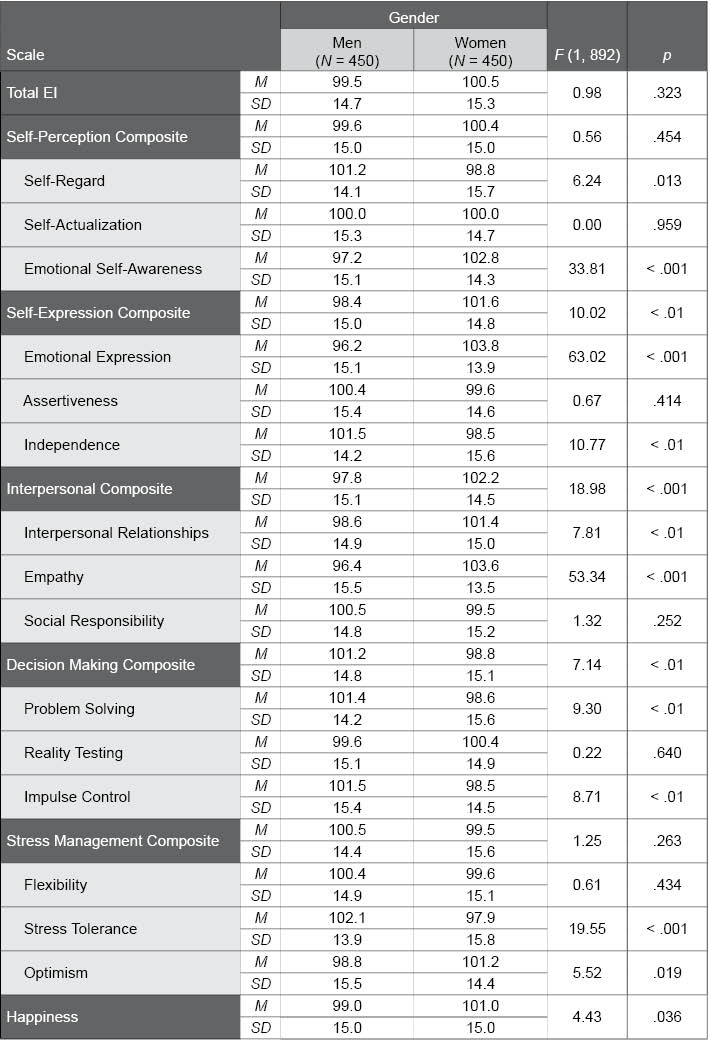
Table I.10. Age Group Differences in the EQ-i 2.0 Swedish Normative Sample
The following table provides EQ-i 2.0 standard score scale means and standard deviations for the various age groups in the Swedish normative sample. F and p values convey the statistical significance of age group differences; p values lower than .01, which were found for most scales, suggest significant differences among the age groups.
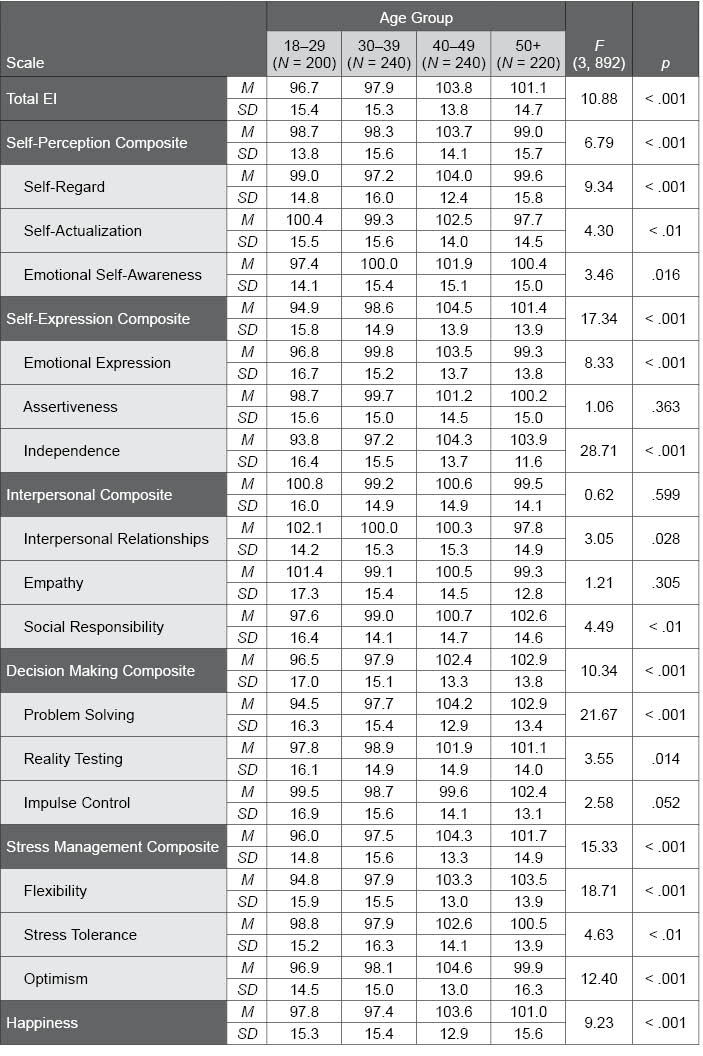
Figure I.1. Histogram of EQ-i 2.0 Total EI Standard Scores in the Swedish Normative Sample
This figure illustrates the distribution of EQ-i 2.0 Total EI standard scores in the Swedish normative sample. The distribution of the actual scores closely approximates the normal “bell-shaped” curve (shown using the black curved line), which suggests that it is unnecessary to apply a normalizing transformation to the scores. Distributions for most other composite scales and subscales show a similar pattern, some with a slight negative skew.
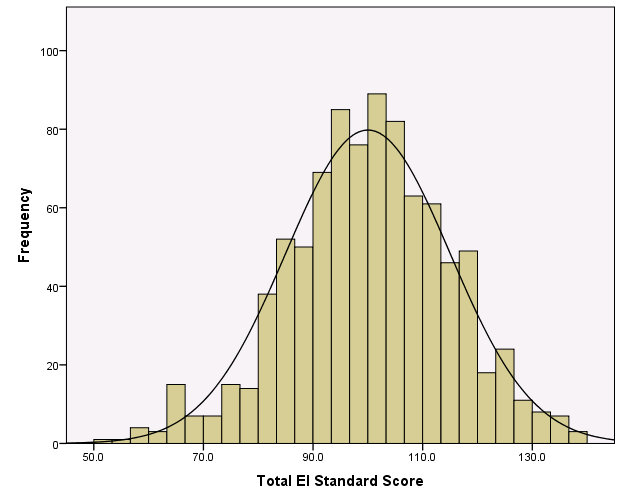
Table I.11. Internal Consistency of EQ-i 2.0 Scales in the Swedish Normative Sample
The following table summarizes the internal consistency (Cronbach’s alpha) values for the EQ-i 2.0 scales in the Swedish normative sample, presented overall and separately by Gender and Age norm group. Alpha values range from 0.00 to 1.00. Higher values, like those found for most scales in the Swedish normative sample, provide evidence for strong reliability.
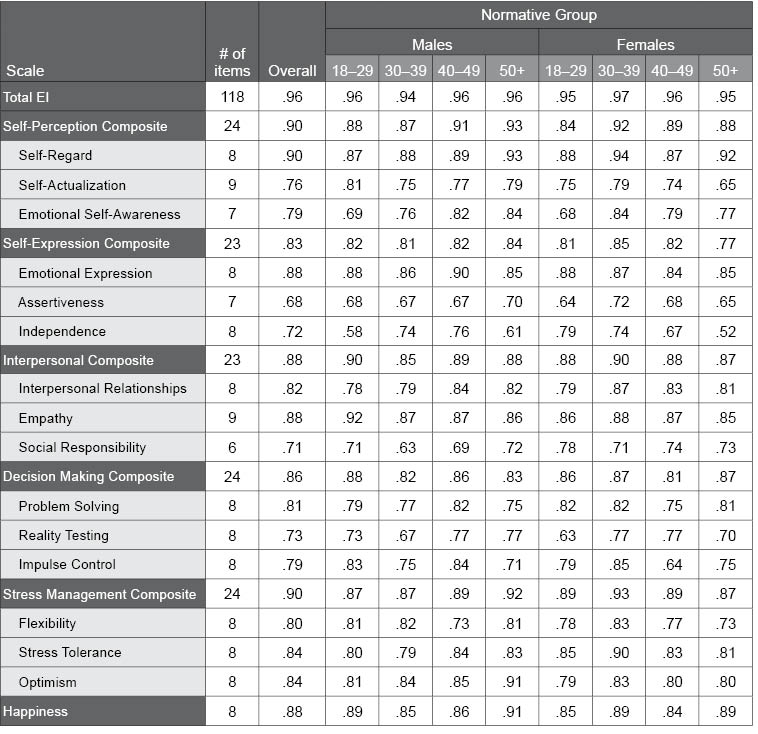
Table I.12. Correlations Among EQ-i 2.0 Composite Scales in the Swedish Normative Sample
The following table illustrates the correlations among the EQ-i 2.0 composite scales in the Swedish normative sample. The correlations seen here range from .38 to .71, with higher values suggesting the scales are interrelated and measure a common construct (i.e., emotional intelligence). Very high values (e.g., > .90) would suggest a unidimensional factor structure. Moderate to large correlations, like those found in the Swedish normative sample, support both the concept that the scales measure an underlying common construct, as well as the multidimensional factor structure of the EQ-i 2.0.

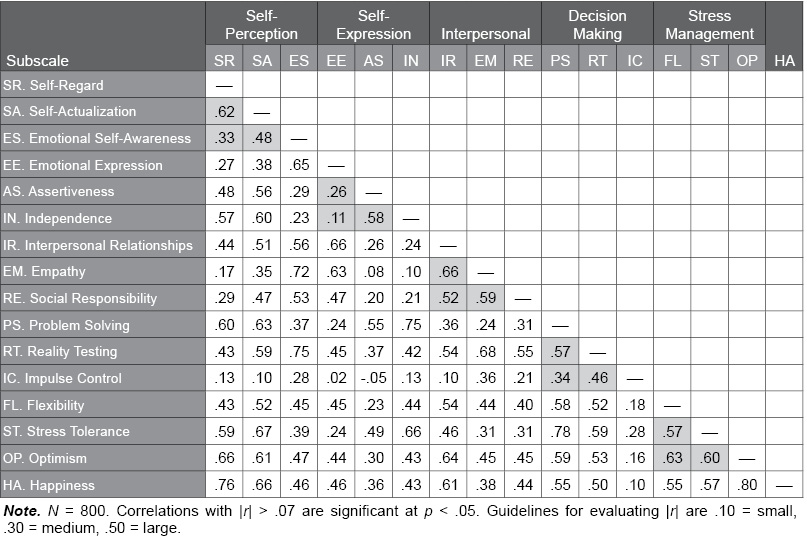
Table I.13. Correlations Among EQ-i 2.0 Subscales in the Swedish Normative Sample
The following table illustrates the correlations among the EQ-i 2.0 subscales in the Swedish normative sample. The correlations seen here range from |r| = .01 to .76, with higher values suggesting the scales share a relevant common psychological characteristic. Shaded cells indicate correlations between subscales within the same composite scale. Small to large correlations were found within the composite scales, supporting both the concept that the scales measure a common psychological characteristic, as well as the multidimensional factor structure of the EQ-i 2.0.
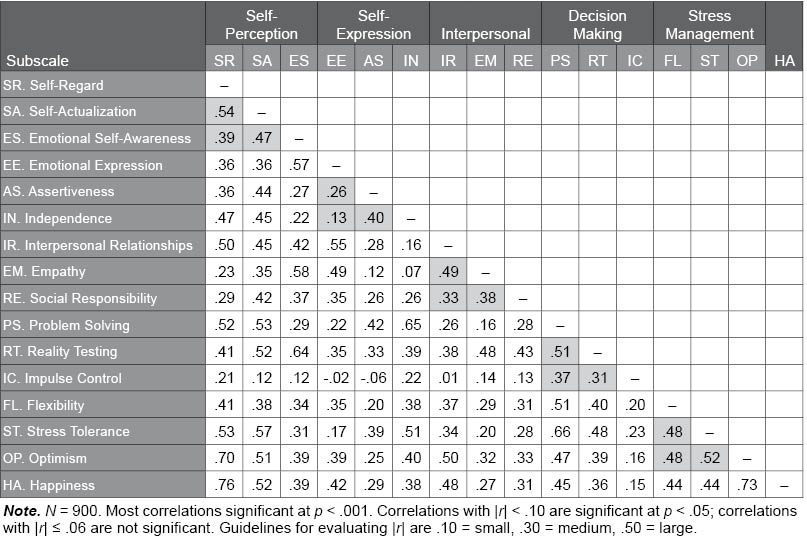
Table I.14. Length of Rater/Ratee Relationship in the EQ 360 2.0 Swedish Normative Sample
The following table describes the length of relationship between raters and ratees in the EQ 360 2.0 Swedish normative sample. The majority of raters (92.2%) indicated that they knew the ratee for at least one year.
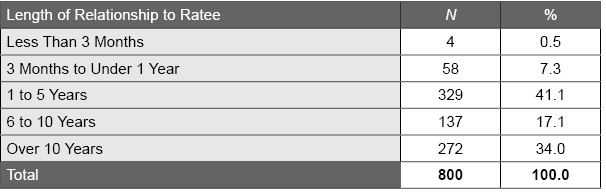
Table I.15. Strength of Rater/Ratee Relationship in the EQ 360 2.0 Swedish Normative Sample
The following table describes the strength of relationship between raters and ratees in the EQ 360 2.0 Swedish normative sample. Most raters (97.1%) knew the person they were rating at least “Fairly Well."
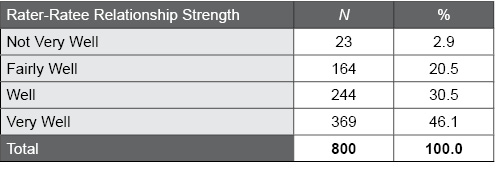
Table I.16. Frequency of Rater/Ratee Interactions in the EQ 360 2.0 Swedish Normative Sample
The following table describes the frequency of interaction between raters and ratees in the EQ 360 2.0 Swedish normative sample. Most raters (94.1%) indicated interaction with the ratee on at least an occasional basis (i.e., at least monthly), which means the ratings are well-informed.
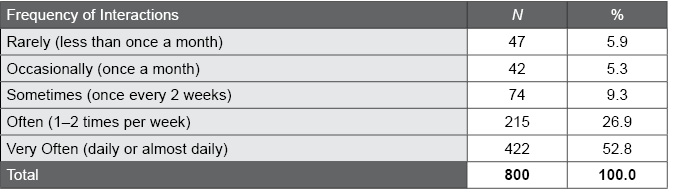
Table I.17. Ratee Age Group by Gender Distribution in the EQ 360 2.0 Swedish Normative Sample
The following table describes the gender distribution of ratees in the EQ 360 2.0 Swedish normative sample within age groups.
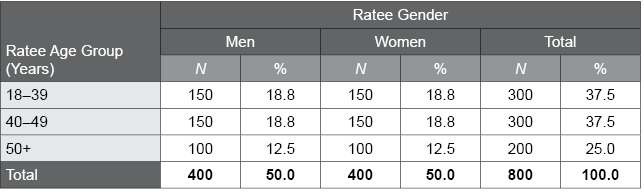
Table I.18. Ratee Gender by Rater Type Distribution in the EQ 360 2.0 Swedish Normative Sample
The following table describes the gender distribution of ratees in the EQ 360 2.0 Swedish normative sample within each rater type.
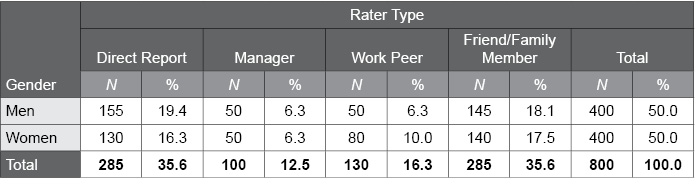
Table I.19. Ratee Age Group by Rater Type Distribution in the EQ 360 2.0 Swedish Normative Sample
The following table describes the age group distribution of ratees in the EQ 360 2.0 Swedish normative sample within each rater type.
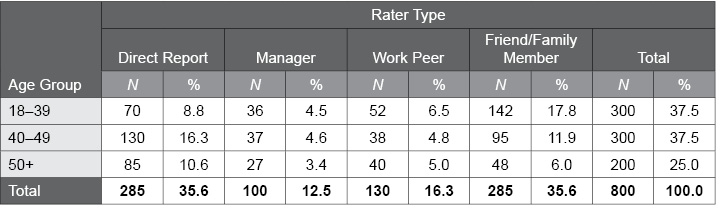
Table I.20. Geographic Distribution of the EQ 360 2.0 Swedish Normative Sample by Region
The following table presents the geographic distribution for the EQ 360 2.0 Swedish normative sample by region.
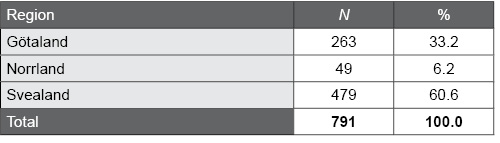
Table I.21. Geographic Distribution of the EQ 360 2.0 Swedish Normative Sample by Province
The following table presents the geographic distribution for the EQ 360 2.0 Swedish normative sample by province.
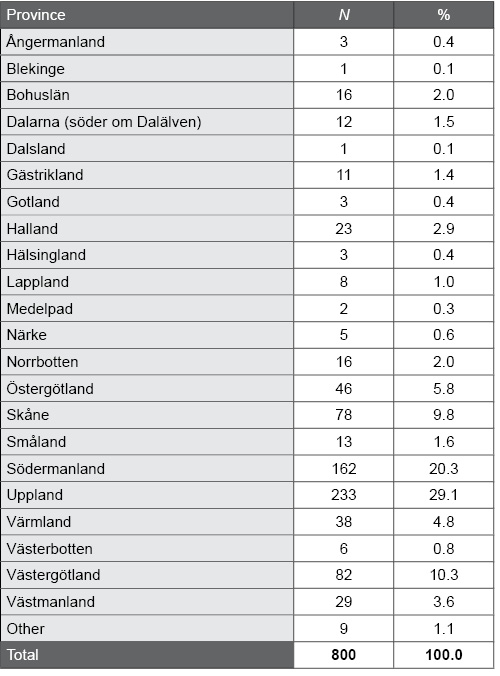
Table I.22. Education Level Distribution of Ratees in the EQ 360 2.0 Swedish Normative Sample
The following table summarizes the education level distribution of the EQ 360 2.0 Swedish normative sample. These proportions are similar to those found in the EQ-i 2.0 Swedish normative sample. Most applications of the EQ-i 2.0 and EQ 360 2.0 in Sweden (and in other countries) are within professional contexts; as such, most of the data were collected about individuals with higher education levels.
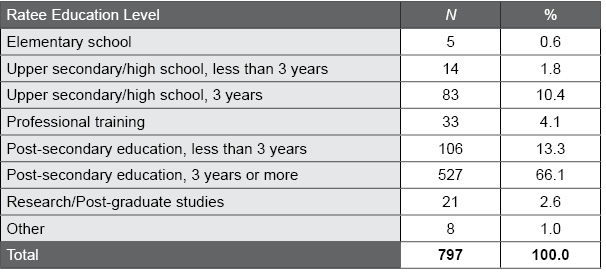
Table I.23. Employment Status Distribution of Ratees in the EQ 360 2.0 Swedish Normative Sample
The following table summarizes the employment status distribution of the EQ 360 2.0 Swedish normative sample. These proportions are similar to those found in the EQ-i 2.0 Swedish normative sample.
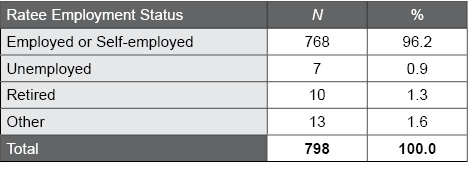
Table I.24. Occupation Area Distribution of Ratees in the EQ 360 2.0 Swedish Normative Sample
The following table summarizes the occupation area distribution of the EQ 360 2.0 Swedish normative sample. These proportions are similar to those found in the EQ-i 2.0 Swedish normative sample.
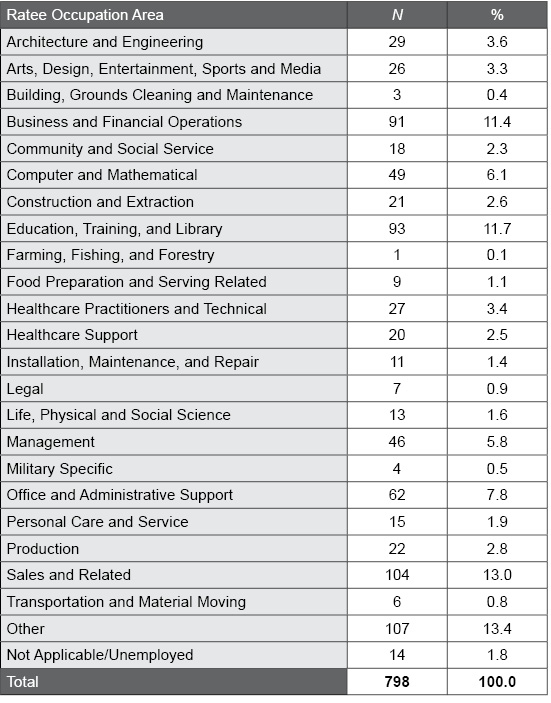
Table I.25. Organizational Level Distribution of the EQ 360 2.0 Swedish Normative Sample
The following table summarizes the organizational level distribution of the EQ 360 2.0 Swedish normative sample.
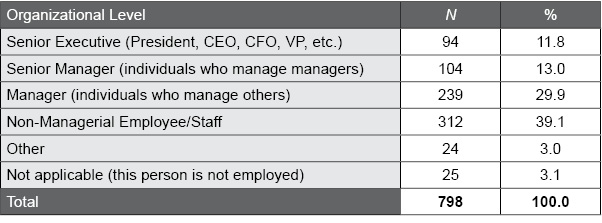
Table I.26. Effect Sizes for Gender, Age, and Rater Type Effects in the EQ 360 2.0 Swedish Normative Sample
The following table summarizes the effect sizes for the effects of the ratee’s gender and age, as well as rater type on the EQ 360 2.0 Total EI score, composite scales, and subscales in the Swedish normative sample. The results suggest some small to moderate effect sizes; however, in order to remain consistent with the EQ 360 2.0 norms used across the world, overall norms are used for the EQ 360 2.0 Swedish norms.
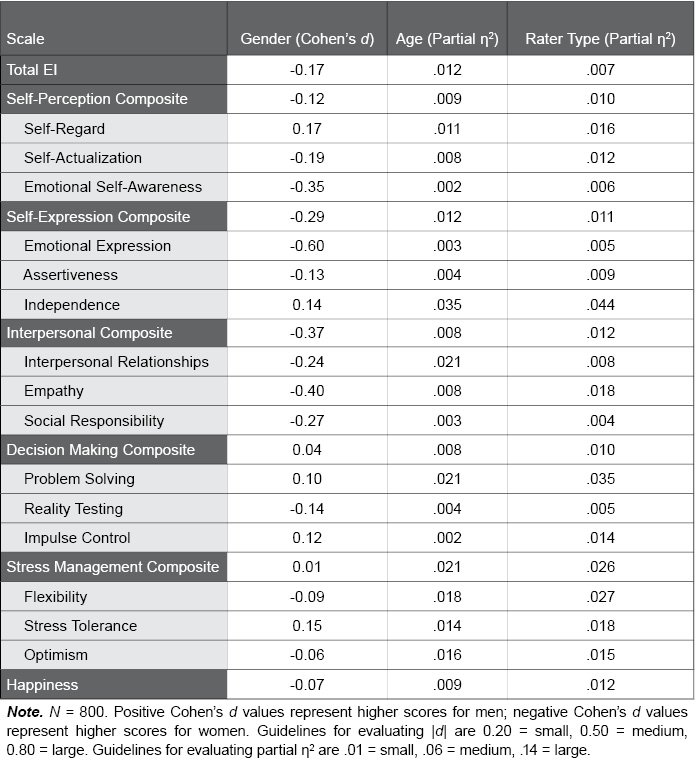
Table I.27. Gender Differences of Ratees in the EQ 360 2.0 Swedish Normative Sample
The following table provides EQ 360 2.0 standard score scale means and standard deviations for men and women in the Swedish normative sample. F and p values convey the statistical significance of gender differences; p values lower than .01, which were found for several scales, indicate significant differences between men and women.
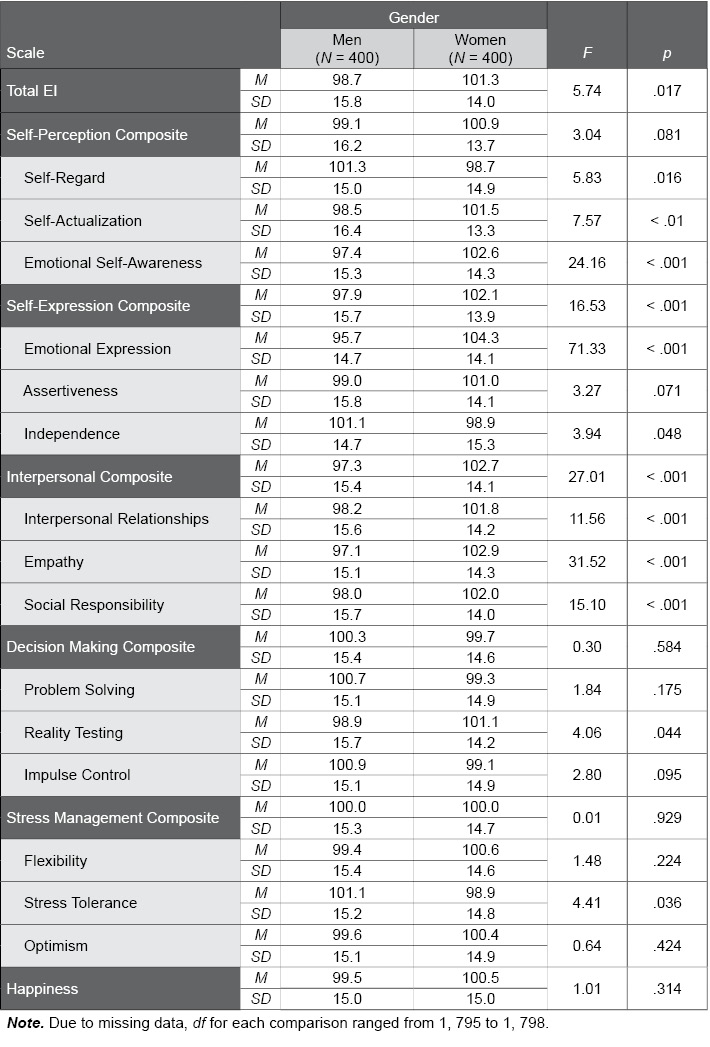
Table I.28. Ratee Age Differences in the EQ 360 2.0 Swedish Normative Sample
The following table provides EQ 360 2.0 standard score scale means and standard deviations for the various ratee age groups in the Swedish normative sample. F and p values convey the statistical significance of age group differences; although some results were statistically significant (p values lower than .01), effect sizes were negligible for most scales (see Table I.26).
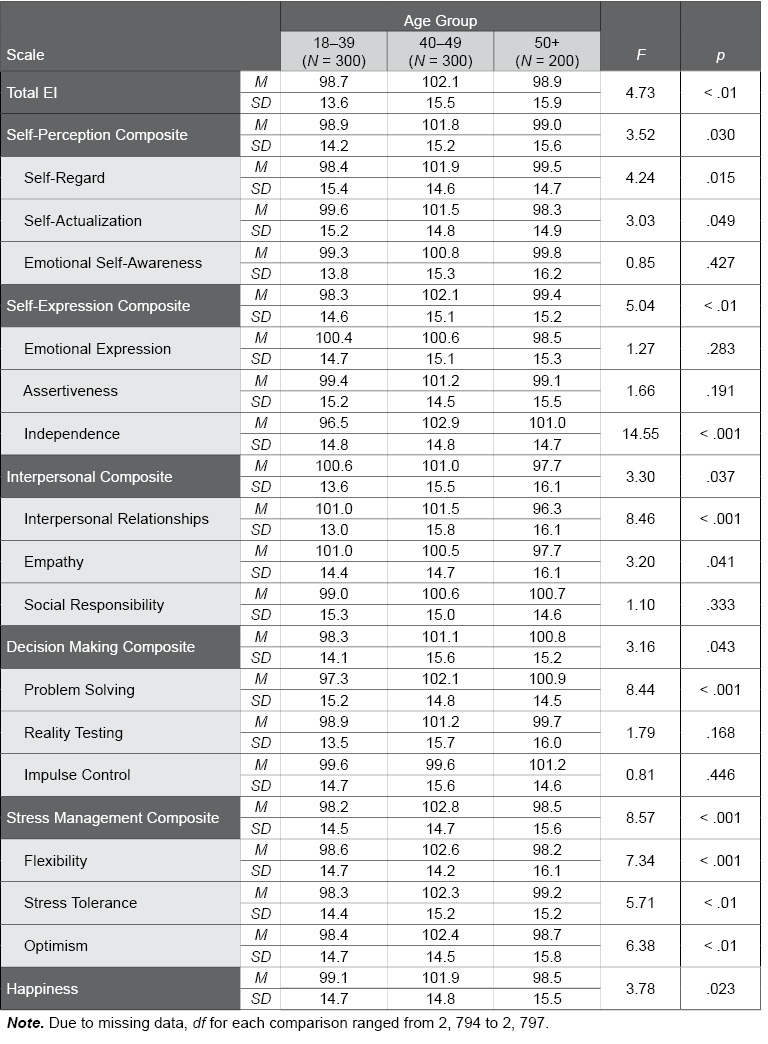
Table I.29. Rater Type Differences in the EQ 360 2.0 Swedish Normative Sample
The following table provides EQ 360 2.0 standard score scale means and standard deviations for the various rater types in the Swedish normative sample. F and p values convey the statistical significance of rater type differences; although some results were statistically significant (p values lower than .01), effect sizes were negligible for most scales (see Table I.26).
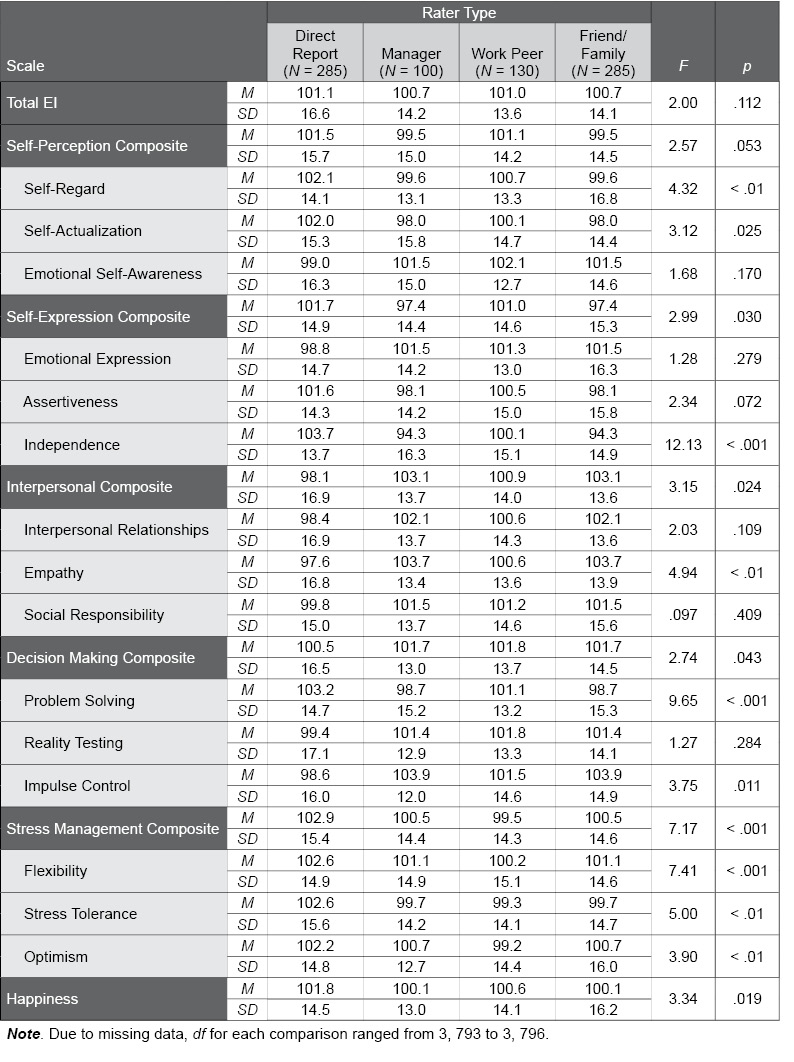
Figure I.2. Histogram of EQ 360 2.0 Total EI Standard Scores in the Swedish Normative Sample
This figure illustrates the distribution of EQ 360 2.0 Total EI standard scores in the Swedish normative sample. The distribution of the actual scores approximates the normal "bell-shaped" curve (shown using the black curved line), which suggests that it is unnecessary to apply a normalizing transformation to the scores.
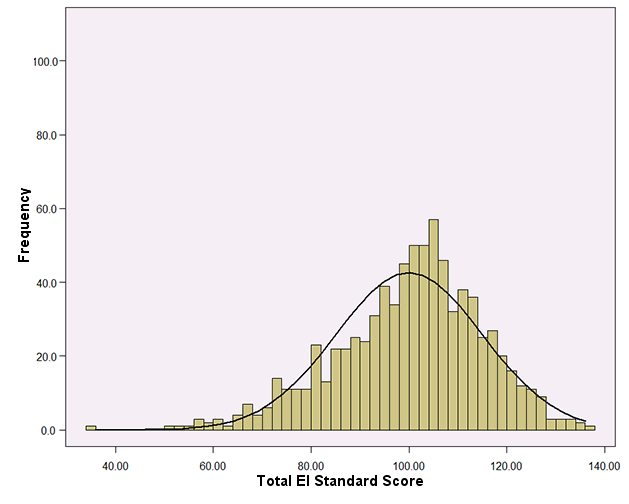
Table I.30. Internal Consistency of EQ 360 2.0 Scales in the Swedish Normative Sample
The following table summarizes the internal consistency (Cronbach’s alpha) values for the EQ 360 2.0 scales in the Swedish normative sample. Alpha values range from 0.00 to 1.00. Higher values provide evidence for the strong reliability of the EQ 360 2.0, as was found in the EQ 360 2.0 Swedish normative sample.
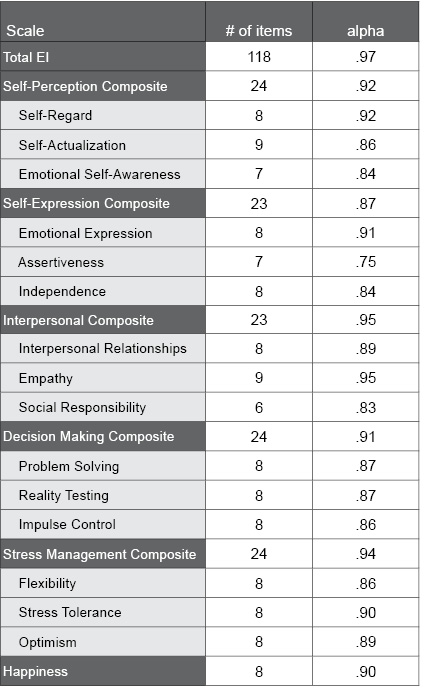
Table I.31. Correlations Among EQ 360 2.0 Composite Scales in the Swedish Normative Sample
The following table illustrates the correlations among the EQ 360 2.0 composite scales in the Swedish normative sample. The correlations seen here range from .53 to .77, with higher values suggesting the composite scales are interrelated and measure a common construct (i.e., emotional intelligence). Very high values (e.g., > .90) would suggest a unidimensional factor structure. The correlations found in the Swedish normative sample support both the concept that the composite scales measure an underlying common construct, as well as the multidimensional factor structure of the EQ 360 2.0.
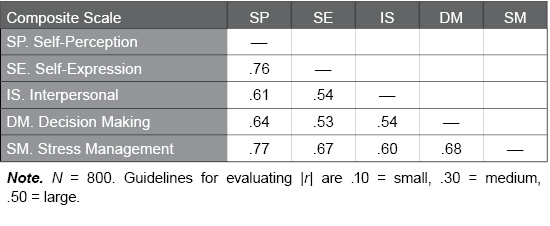
Table I.32. Correlations Among EQ 360 2.0 Subscales in the Swedish Normative Sample
The following table illustrates the correlations among the EQ 360 2.0 subscales in the Swedish normative sample. The correlations seen here range from .02 to .80, with higher values suggesting the scales share a relevant common psychological characteristic. Shaded cells indicate correlations between subscales within the same composite scale. For the most part, moderate to large correlations were found within the composite scales, supporting the multidimensional factor structure of the EQ 360 2.0.