Appendix I. EQ-i 2.0 Swedish Norms
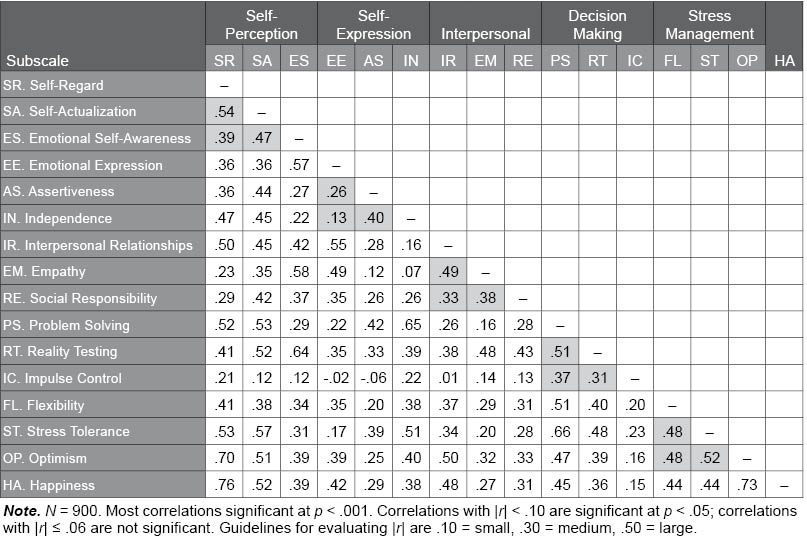
Table I.13. Correlations Among EQ-i 2.0 Subscales in the Swedish Normative Sample
The following table illustrates the correlations among the EQ-i 2.0 subscales in the Swedish normative sample. The correlations seen here range from |r| = .01 to .76, with higher values suggesting the scales share a relevant common psychological characteristic. Shaded cells indicate correlations between subscales within the same composite scale. Small to large correlations were found within the composite scales, supporting both the concept that the scales measure a common psychological characteristic, as well as the multidimensional factor structure of the EQ-i 2.0.