Appendix I. EQ-i 2.0 Swedish Norms
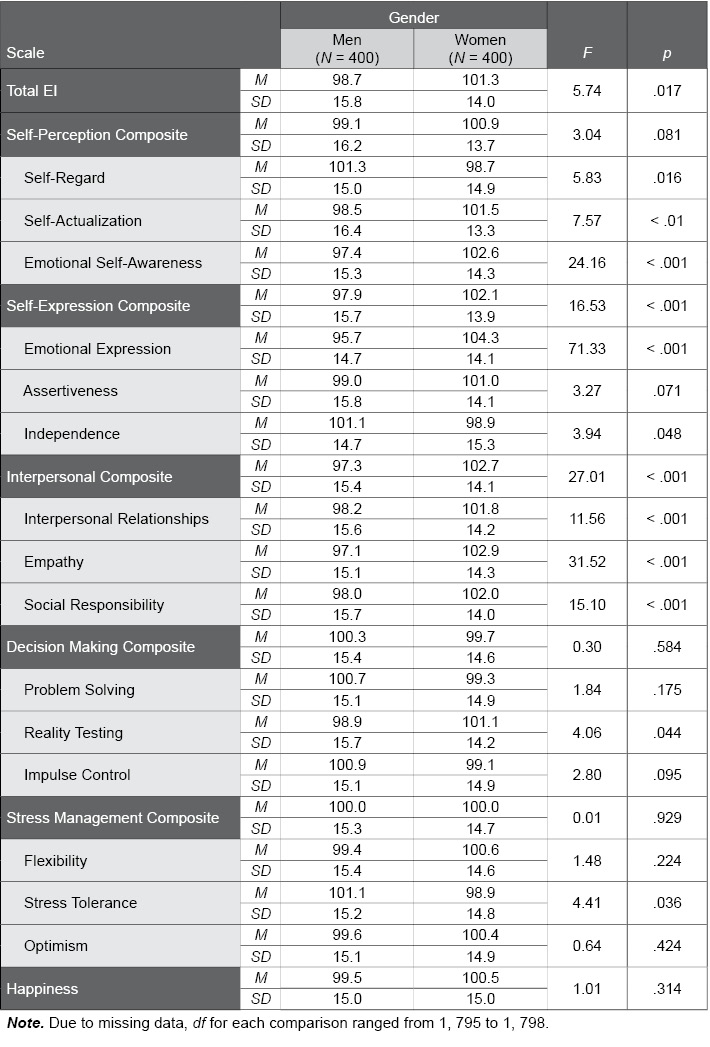
Table I.27. Gender Differences of Ratees in the EQ 360 2.0 Swedish Normative Sample
The following table provides EQ 360 2.0 standard score scale means and standard deviations for men and women in the Swedish normative sample. F and p values convey the statistical significance of gender differences; p values lower than .01, which were found for several scales, indicate significant differences between men and women.