Appendix I. EQ-i 2.0 Swedish Norms
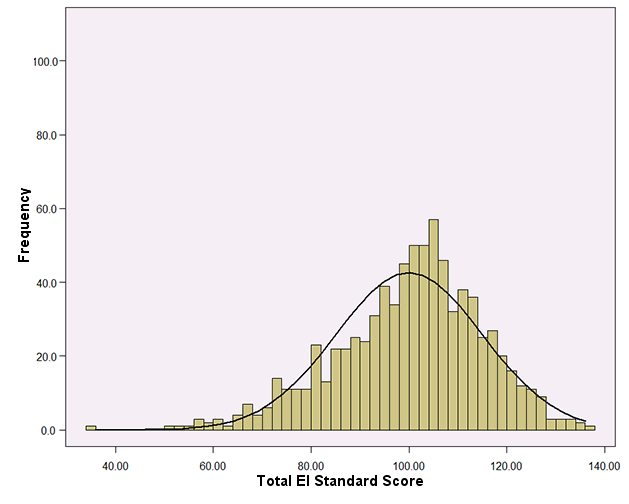
Figure I.2. Histogram of EQ 360 2.0 Total EI Standard Scores in the Swedish Normative Sample
This figure illustrates the distribution of EQ 360 2.0 Total EI standard scores in the Swedish normative sample. The distribution of the actual scores approximates the normal "bell-shaped" curve (shown using the black curved line), which suggests that it is unnecessary to apply a normalizing transformation to the scores.