EQ-i 2.0 Leadership Report Interpretive Guide
Welcome to a new way of examining emotional intelligence skills! The EQ-i 2.0 Leadership Report was designed for those who work with leaders of all levels, to provide an in-depth look at EI strengths and weaknesses through the lens of leadership. This chapter describes the features of the Leadership Report, an overview of the research behind EI and leadership, interpretation suggestions for working with the new Leadership Report options, as well as a description of how the report was developed.
The EQ-i 2.0 Leadership Report correlates EQ-i 2.0 subscales with leadership performance across various competencies. It is a robust and engaging framework through which leaders can compare their results to a cohort of top leaders (see Leadership Sample Data Collection for a description of the leadership sample).
Consistent with the Workplace Report, the Leadership Report is flexible to the individual needs of you and your clients. As such, many of the features described in the next section are options, meaning you can turn them on and off depending on your interpretation needs. Both popular and academic literature are teeming with leadership models and theories; you may use some of these models or you may use your own theory. Either way, the Leadership Report uses a framework that aligns itself to almost any leadership or competency model. Its malleable nature, much like EI itself, was one of the key characteristics emphasized in the development of the framework.
The Leadership Report builds off of the foundation of the Workplace Report, with several added enhancements. This section describes the enhancements that have been incorporated into the Leadership Report, including the main features of the report, as well as several optional features that you can turn on or off.
Main Report Features
INTRODUCTION
The EQ-i 2.0 Leadership Report includes an Introduction page for your client that outlines the following:
- A guide to understanding the report
- The link between emotional intelligence and leadership
- Tips for getting the most out of the report
EXECUTIVE SUMMARY
An Executive Summary page showcases the client’s three highest and three lowest scoring EI skills. You can quickly pinpoint areas in which the client excels—areas that help fuel organizational and personal performance—as well as areas that are in need of development, in order to harness the client’s leadership ability.
| If there is a tie for the third highest and/or third lowest score among EI skills, the following note will appear: Note: You have other subscales that have tied for the highest/lowest three scores. |
OVERVIEW OF RESULTS PAGE
The EQ-i 2.0 Leadership Report is built on the research-based and theoretical underpinnings of the EQ-i 2.0 Model. The model preserves the foundation and integrity of the original EQ-i (Bar-On, 1997) while featuring improvements to the standardization, reliability, and validity of the original assessment.
The Leadership Report contains the same EQ-i 2.0 Total EI, composite, subscale, and Validity Indicator scores as the Workplace Report (provided the same norms are chosen). The Leadership Report presents an interpretation of the EQ-i 2.0 results through a leadership lens, and allows you to discover how your client’s scores and results fare in comparison to top leaders.
SUBSCALE PAGES
On every EQ-i 2.0 subscale page, your client will be provided with an interpretation of his/her score, the associated leadership and organizational impact, and some strategies to help leverage each EI skill to reach his/her full potential in a given leadership role. As with the Workplace Report, there is also an option to turn on the Balancing EI section, which helps the client understand the importance of achieving balance across his/her EQ-i 2.0 profile.
Optional Report Features
LEADERSHIP POTENTIAL PAGE
- The Leadership Potential page examines four key leadership dimensions (Authenticity, Coaching, Insight, and Innovation) (see Creating the Leadership Potential Page in the Development of the EQ-i 2.0 Leadership Report section) and highlights associated and relevant EI skills (based on research and theory) that help promote success in the client’s leadership role.
- A leadership derailers section examines how low scores for specific EI skills may particularly hamper leadership success.
- If the Leadership Potential page is turned on, graphical icons will appear on every subscale page linking the subscale to the four leadership dimensions.
The leadership dimensions are as follows:
Authenticity

An authentic leader serves as a role model for moral and fair behavior. A transparent approach commands esteem and confidence from employees.
Coaching
A leader who coaches effectively is seen as a mentor who supports employee growth. Employees are nurtured towards achieving their highest levels of performance.
Insight
A leader provides insight by sharing a purpose and hopeful vision for colleagues to follow. Employees are compelled and inspired to exceed goals.
Innovation
An innovative leader focuses on taking risks, spurring colleagues’ ingenuity and autonomous thought. Knowledge is valued and challenges are viewed as learning opportunities.
LEADERSHIP BAR
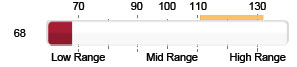
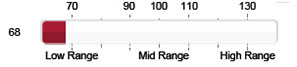
A yellow leadership bar appears on the Overview of Results page, and above all other bar graphs on every subscale page. The Leadership Bar highlights how the client’s scores fare in comparison to top leaders (see Creating the Leadership Bar in the Development of the EQ-i 2.0 Leadership Report section). The client can focus development efforts in areas in which he/she scored lower than other successful leaders, in order to maximize his/her leadership capability.
If the Leadership Bar is turned on, interpretive text describing your client’s score in relation to the leadership bar will appear in the “What Your Score Means” section of every subscale page.
If the Leadership Bar is turned off, a yellow bar will not appear:
CURRENT LEADERSHIP TOPIC PAGES
Three current topics in leadership are explored using the EQ-i 2.0 model. Best practices are suggested for leveraging EI to provide your client with guidance in:
- Managing conflict
- Achieving work-life balance
- Leading a multigenerational team
You may choose to turn on one, some, or all of these leadership topic pages depending on the nature of the leadership issues you and your clients are working with. These leadership topics help ensure that the report delivers a thorough overview of current and relevant leadership issues and can help you apply EI as a solution to the challenges and business issues that your client may encounter.
The same optional features on the Workplace Report are available for the Leadership Report. -Turn on/off scores, labels and Confidence Intervals |
Research suggests that high levels of emotional intelligence in some areas can help predict leadership success, while low levels of emotional intelligence in other areas can help predict leadership derailment (i.e., unsuccessful, if not catastrophic, leadership). The EQ-i 2.0 Leadership Report offers an assessment of the factors of emotional intelligence that are empirically linked to specific behaviors of successful leaders. As such, it is a useful tool for all those who assess leadership effectiveness and/or aptitude within organizations, including human resources personnel who are responsible for the selection, development, and promotion of adept leaders.
There is support for the theory that leaders score higher on EI skills than the general population. In a study conducted by Stein et al. (2009), top executives significantly differed from the general population on the EQ-i in 8 of 15 EQ-i subscales. Moreover, leaders who demonstrated higher levels of empathy, self-regard, reality testing, and problem solving were more likely to generate high profits for companies.
Due to often changing market forces, a volatile environment, and pressures to accomplish more with fewer resources, leaders require more than technical knowledge to succeed in their role (George, 2000). Researchers have noted that emotional skills are important for successful performance at the executive level (Carmeli, 2003), and become more critical (as compared to IQ or technical savvy) as employees progress through the organizational hierarchy (Dulewicz & Higgs, 2003; Goleman et al., 2002). McClelland (1999) demonstrated that division presidents with higher levels of EI outperformed performance targets by 15–20% and had a 94% retention rate. On the other hand, division presidents who scored lower on EI competencies under-performed by 20% and had a 50% retention rate.
Much of leadership and EI research centers around the model of transformational leadership (e.g., Ashkanasy and Tse, 2000; Barling, Slater, & Kelloway, 2000). As its name implies, transformational leadership looks at the process of changing and transforming individuals. Burns (1978) described transformational leadership as a process in which leaders and subordinates raise one another to higher levels of morality and motivation. Transformational leaders motivate individuals to perform beyond baseline expectations, arouse dormant needs in their subordinates, and are able to regulate their own emotions. Transformational leaders often seek to empower subordinates, which increases subordinate commitment. An effective transformational leader knows how emotions affect others’ interactions, whom others will follow, and how to make decisions. Transformational leaders are also able to understand and manage their own emotions, making it possible for them to be flexible and creative in their decision making, consider alternative approaches, and have the self-confidence needed to take action (Bass & Avolio, 1997). Emotional intelligence plays a particularly important role in transforming others. Research associates EI and transformational leadership, and shows positive relationships between the two constructs (e.g., Barling, Slater, & Kelloway, 2000).
Further support for the role of emotional intelligence in leadership can be substantiated by two independent meta-analyses. A meta-analysis is a “study of studies” that helps to remove the subjective interpretation around inconsistent research findings. In the first meta-analysis, a strong positive relationship was found linking emotional intelligence to leadership (Martin, 2008). In the second meta-analysis conducted by Harms and Crede (2010), the link between emotional intelligence and leadership was further corroborated when taking into account same-source raters (consistent raters of emotional intelligence and leadership).
The EQ-i 2.0 Leadership Report is useful for leaders at all levels, from front-line managers through to the C-level suite (e.g., CEO, COO). The report allows you to reframe the client’s emotional intelligence results and view them through a leadership framework. While interpreting your client’s results, you are reminded to contextualize the results in terms of the client’s particular organization, work culture, and role. By focusing on lower scoring subscales, you can implement a strategy to bolster those particular areas in order for the client to reach his/her true leadership potential. You should take note of any Strategies for Action that seem particularly relevant to your client’s role and organization. Your client should try to implement them in his/her daily responsibilities at work.
You can examine the Executive Summary page to view the client’s three highest and three lowest scoring subscales, and the Leadership Potential page (an optional feature) to examine how your client fares on four essential leadership dimensions that are crucial to successful leadership.
The Leadership Potential page includes a section on Leadership Derailers. If your client scores lower on select subscales that have been associated with lower levels of leadership success (Impulse Control, Stress Tolerance, Problem Solving, Independence), your client may adopt a more passive or avoidant leadership style. For instance, if your client scores low on all four subscales, he/she may make rash decisions, may not maintain composure under pressure, may have difficulty making tough decisions, and may not maintain enough autonomy to exert his/her leadership influence. Targeting development efforts on these lower scoring areas may prove fruitful for your client in order to harness his/her leadership potential.
In addition, by examining your client’s scores relative to the Leadership Bar, you can investigate how your client fares in comparison to scores from top leaders from the leadership sample on Total EI, all composite scales, the 15 subscales and the Well-Being Indicator. You can also view whether your client’s subscales are balanced, and read about current hot topics in leadership (an optional feature).
For more detail on interpretation, please refer to section IV Using the Results, Step by Step Interpretation Sequence (Step 1 through 7)
Leadership Report Philosophy
An exhaustive review of the literature surrounding EI and leadership was conducted as well as market research to determine which leadership dimensions were most applicable to EQ-i 2.0 consultants and administrators. The philosophy behind our leadership research was to arrive at a succinct set of leadership dimensions that underpinned most any leadership model and provided a framework for organizing the EQ-i 2.0 subscales in a way that effectively highlighted leadership development areas for a client.
As mentioned previously, there are a variety of leadership models and tools in use today but many had common themes, particularly leadership theories that have EI behaviors at their core. Additionally, many of our consultants are working with organizations that have their own customized leadership competency frameworks and models for what successful leadership looks like within the company, so it is important that the EQ-i 2.0 Leadership Report use language and leadership dimensions that support these frameworks as well.
The review of the literature led to the arrival of four common leadership dimensions that were inherent to most definitions and models of leadership: Authenticity, Coaching, Insight and Innovation (see Optional Report Features in the Leadership Report Features section). In order to validate that these four areas of leadership are related to EI, data collection efforts were needed, as was a measure of effectiveness in these four leadership areas.
Leadership Sample Data Collection
In a review of the leadership and EI literature, different leadership assessments were identified (e.g., situational, implicit leadership theory), definitions were considered and the Multifactor Leadership Questionnaire (MLQ) by Bass and Avolio (1995) was targeted to use as part of a validity study. The theory behind the MLQ has garnered substantial support in the literature (e.g., Agbor, 2008; Boyatzis, Smith & Blaize, 2006; George, 2003; Kouzes & Posner, 2009) and includes measures of leadership styles that align with the four leadership dimensions outlined above.
Two hundred and twenty-one leaders derived from a variety of organizations throughout North America completed the EQ-i 2.0 and the MLQ. The MLQ assesses different leadership types, such as passive or avoidant leadership (i.e., laissez-faire leadership), leaders who focus on an exchange relationship and use rewards/punishments to get the job done (i.e., transactional leadership), and the gold standard of leadership (i.e., transformational leadership; engaged leaders who are adept at harnessing employee potential) which includes behaviors akin to the four leadership dimensions presented above. EQ-i 2.0 results were correlated with the gold standard (transformational) leadership to determine which EQ-i 2.0 subscales help fuel success in each leadership dimension, and with laissez-faire leadership to see which subscales contribute to leadership derailment. If found to be significant, the various associations could then be used as the theoretical underpinnings for the leadership report.
The majority of participants were male (64.7%), white (79.2%), with at least a bachelor’s degree (85.5%). Average age was 46.8 years. The most highly represented position was CEO (29.0%), followed by Director (19.9%) and Manager (19.9%). The majority of leaders (44.8%) worked in large organizations (i.e., over 400 employees), with an annual revenue exceeding $10 million dollars (57.5%).
See more detailed demographic characteristics of the sample in Table E.1.
Differences Between Leaders and the EQ-i 2.0 Normative Sample
If leaders score higher in EI than the general population, it would support the idea that high EI is a key characteristic of leaders. Scores in our leadership sample were compared to scores from the EQ-i 2.0 general population normative sample. A measure of effect size, Cohen’s d, was calculated for all comparisons (see Standardization, Reliability, and Validity for more information on Cohen’s d). d values describe the size of the difference between the leadership sample scores and the general population scores. The larger the number, the bigger the difference between the two samples (in this case, large positive values indicate higher scores in the leadership sample). Guidelines for evaluating d are 0.20 = small, 0.50 = medium, 0.80 = large.
As expected, the leaders’ scores were significantly higher than the North American norm group (general population). The leadership sample’s average Total EI score was 112.2, compared to the general population normative mean of 100 (d = 0.82, indicating a large effect size). The leadership sample’s scores were also higher than the normative group on all subscales, with means ranging from 104.2 (Impulse Control) to 113.1 (Self-Actualization), compared to the normative mean of 100 (d values ranged from 0.28 to 0.88). See Table E.2 for full results.
As can be viewed in Table E.3., leaders were separated into two groups: those who were classified as high in transformational leadership, and those who were classified as taking a more transactional (or less transformational) approach.
Results indicated that those with predominantly transformational leadership styles scored significantly higher than those with predominantly transactional leadership styles. The size of the effect was moderate (d = 0.48) for the Total EI score (transformational M = 115.4, SD = 11.3; transactional M = 110.1, SD = 11.2). Transformational leaders also had substantially higher scores (ds > .2) on virtually all of the subscales (with the exceptions being Assertiveness, Independence, and Problem Solving). The meaningfully higher scores (i.e., d ≥ 0.20) found in transformational relative to transactional leaders provides preliminary validation for the hypothesis that leaders whose approach values transforming and growing their teams have higher levels of EI than those who are more transactional in nature.
Creating the Leadership Potential Page
A strong positive relationship is expected between EQ-i 2.0 subscales and aspects of transformational leadership. With the exception of Impulse Control, all EQ-i 2.0 scores correlated strongly with all transformational leadership characteristics. See Table E.4. for all correlations. The correlations, along with theoretical considerations, were used to inform decisions about which subscales to assign to the four leadership dimensions. These groupings are shown in Figure E.1.
Figure E.1.
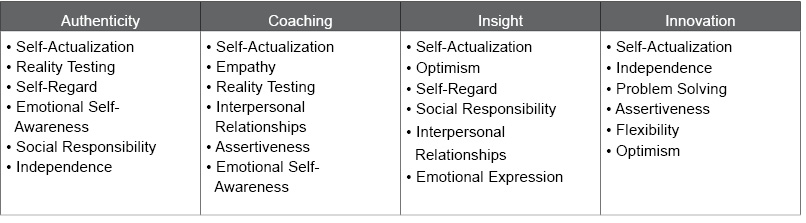
Regardless of leadership role or leadership theory, one could argue that without the ability to coach, innovate, communicate a compelling vision, and serve as an ethical role model, leading an effective team would seem nearly impossible. Using these four leadership dimensions as a lens can help you and your client hone in on the EQ-i 2.0 subscales that may require development and the leadership areas that may be the most affected.
It also shows you the impact certain EQ-i 2.0 subscales have on your client’s overall leadership performance. For instance, Self-Actualization is a key facet of all four leadership dimensions, while other EQ-i 2.0 subscales may only directly affect one or two dimensions.
The bottom of the Leadership Potential page includes information about possible Leadership Derailers. If emotional intelligence is positively related to transformational leadership, are there any subscales that, if lacking, relate to leadership derailment? To answer this question, EQ-i 2.0 subscale scores were correlated with the Laissez-Faire score. Laissez-Faire leaders demonstrate avoidance of responsibility and action; they are essentially leaders by the nature of their position in the organization, and not by their presence, ability to motivate, or positive impact that they have on others. Research has shown that this type of non-leadership is, at a minimum, not related to positive outcomes (e.g., Judge & Piccolo, 2004) and, at most, destructive—contributing to distress, role ambiguity, and conflict (Skogstad et al., 2007). As predicted, the EQ-i 2.0 showed strong negative correlations with Laissez-Faire leadership. Correlations ranged from -.50 for Problem Solving to -.20 for Empathy and Social Responsibility (see Table E.5). A negative correlation here suggests that as Emotional Intelligence increases, the risk of avoiding leadership responsibilities decreases.
Lower scores in any EQ-i 2.0 subscale may make it more difficult for a leader to be inspirational, visionary, innovative, and able to motivate their team to outperform expectations. Lower scores across the profile may suggest your client tends to avoid leadership responsibilities or derails from influential positions of leadership.
Although all subscales are important to prevent leadership derailment, to provide development focus, four subscales were chosen to appear in the Leadership Derailers section due to their stronger connection to leadership derailment (Laissez-Faire leadership). These four subscales were chosen based on both practical significance and statistical importance:
- - Impulse Control
- - Stress Tolerance
- - Problem Solving
- - Independence
Creating the Leadership Bar
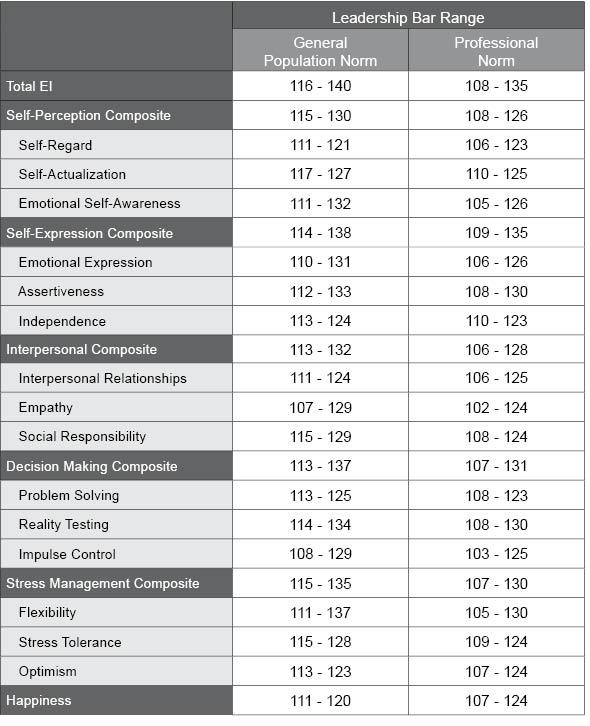
Should you choose, you can compare your clients’ results to those of the top leaders in the leadership sample. Only the top leaders, those scoring in the top 50% of our sample on the EQ-i 2.0, were included in this comparison group. As an administrator, this means your client is being compared to those exceptional leaders who demonstrate high EI, and not just to any leader. A bar indicating the range of these top leaders’ scores is plotted against your client’s scores. Table E.6 presents the range of standard scores for the Leadership Bar.
Table E.6. EQ-i 2.0 Leadership Bar Ranges
The research findings presented in this interpretation guide demonstrate that emotional intelligence (assessed by the EQ-i 2.0) is significantly related to leadership success, derailment and different aspects of leadership in meaningful ways. Based on the nature of these findings, you can be assured that the EQ-i 2.0 Leadership Report is a valid and reliable framework through which to interpret results, meaning that it accurately measures what is was designed to measure (i.e., emotional intelligence). Research with the EQ-i 2.0 is encouraged to learn more about the importance of emotional and social functioning as it applies to various aspects of leadership as well as other aspects of professional success.