Part V: creating the EQ-i 2.0 and EQ 360 2.0
EQ-i 2.0 Leadership Report Interpretive Guide
Development of the EQ-i 2.0 Leadership Report
Leadership Report Philosophy
An exhaustive review of the literature surrounding EI and leadership was conducted as well as market research to determine which leadership dimensions were most applicable to EQ-i 2.0 consultants and administrators. The philosophy behind our leadership research was to arrive at a succinct set of leadership dimensions that underpinned most any leadership model and provided a framework for organizing the EQ-i 2.0 subscales in a way that effectively highlighted leadership development areas for a client.
As mentioned previously, there are a variety of leadership models and tools in use today but many had common themes, particularly leadership theories that have EI behaviors at their core. Additionally, many of our consultants are working with organizations that have their own customized leadership competency frameworks and models for what successful leadership looks like within the company, so it is important that the EQ-i 2.0 Leadership Report use language and leadership dimensions that support these frameworks as well.
The review of the literature led to the arrival of four common leadership dimensions that were inherent to most definitions and models of leadership: Authenticity, Coaching, Insight and Innovation (see Optional Report Features in the Leadership Report Features section). In order to validate that these four areas of leadership are related to EI, data collection efforts were needed, as was a measure of effectiveness in these four leadership areas.
Leadership Sample Data Collection
In a review of the leadership and EI literature, different leadership assessments were identified (e.g., situational, implicit leadership theory), definitions were considered and the Multifactor Leadership Questionnaire (MLQ) by Bass and Avolio (1995) was targeted to use as part of a validity study. The theory behind the MLQ has garnered substantial support in the literature (e.g., Agbor, 2008; Boyatzis, Smith & Blaize, 2006; George, 2003; Kouzes & Posner, 2009) and includes measures of leadership styles that align with the four leadership dimensions outlined above.
Two hundred and twenty-one leaders derived from a variety of organizations throughout North America completed the EQ-i 2.0 and the MLQ. The MLQ assesses different leadership types, such as passive or avoidant leadership (i.e., laissez-faire leadership), leaders who focus on an exchange relationship and use rewards/punishments to get the job done (i.e., transactional leadership), and the gold standard of leadership (i.e., transformational leadership; engaged leaders who are adept at harnessing employee potential) which includes behaviors akin to the four leadership dimensions presented above. EQ-i 2.0 results were correlated with the gold standard (transformational) leadership to determine which EQ-i 2.0 subscales help fuel success in each leadership dimension, and with laissez-faire leadership to see which subscales contribute to leadership derailment. If found to be significant, the various associations could then be used as the theoretical underpinnings for the leadership report.
The majority of participants were male (64.7%), white (79.2%), with at least a bachelor’s degree (85.5%). Average age was 46.8 years. The most highly represented position was CEO (29.0%), followed by Director (19.9%) and Manager (19.9%). The majority of leaders (44.8%) worked in large organizations (i.e., over 400 employees), with an annual revenue exceeding $10 million dollars (57.5%).
See more detailed demographic characteristics of the sample in Table E.1.
Differences Between Leaders and the EQ-i 2.0 Normative Sample
If leaders score higher in EI than the general population, it would support the idea that high EI is a key characteristic of leaders. Scores in our leadership sample were compared to scores from the EQ-i 2.0 general population normative sample. A measure of effect size, Cohen’s d, was calculated for all comparisons (see Standardization, Reliability, and Validity for more information on Cohen’s d). d values describe the size of the difference between the leadership sample scores and the general population scores. The larger the number, the bigger the difference between the two samples (in this case, large positive values indicate higher scores in the leadership sample). Guidelines for evaluating d are 0.20 = small, 0.50 = medium, 0.80 = large.
As expected, the leaders’ scores were significantly higher than the North American norm group (general population). The leadership sample’s average Total EI score was 112.2, compared to the general population normative mean of 100 (d = 0.82, indicating a large effect size). The leadership sample’s scores were also higher than the normative group on all subscales, with means ranging from 104.2 (Impulse Control) to 113.1 (Self-Actualization), compared to the normative mean of 100 (d values ranged from 0.28 to 0.88). See Table E.2 for full results.
As can be viewed in Table E.3., leaders were separated into two groups: those who were classified as high in transformational leadership, and those who were classified as taking a more transactional (or less transformational) approach.
Results indicated that those with predominantly transformational leadership styles scored significantly higher than those with predominantly transactional leadership styles. The size of the effect was moderate (d = 0.48) for the Total EI score (transformational M = 115.4, SD = 11.3; transactional M = 110.1, SD = 11.2). Transformational leaders also had substantially higher scores (ds > .2) on virtually all of the subscales (with the exceptions being Assertiveness, Independence, and Problem Solving). The meaningfully higher scores (i.e., d ≥ 0.20) found in transformational relative to transactional leaders provides preliminary validation for the hypothesis that leaders whose approach values transforming and growing their teams have higher levels of EI than those who are more transactional in nature.
Creating the Leadership Potential Page
A strong positive relationship is expected between EQ-i 2.0 subscales and aspects of transformational leadership. With the exception of Impulse Control, all EQ-i 2.0 scores correlated strongly with all transformational leadership characteristics. See Table E.4. for all correlations. The correlations, along with theoretical considerations, were used to inform decisions about which subscales to assign to the four leadership dimensions. These groupings are shown in Figure E.1.
Figure E.1.
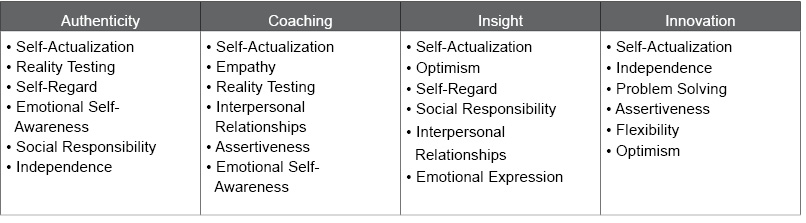
Regardless of leadership role or leadership theory, one could argue that without the ability to coach, innovate, communicate a compelling vision, and serve as an ethical role model, leading an effective team would seem nearly impossible. Using these four leadership dimensions as a lens can help you and your client hone in on the EQ-i 2.0 subscales that may require development and the leadership areas that may be the most affected.
It also shows you the impact certain EQ-i 2.0 subscales have on your client’s overall leadership performance. For instance, Self-Actualization is a key facet of all four leadership dimensions, while other EQ-i 2.0 subscales may only directly affect one or two dimensions.
The bottom of the Leadership Potential page includes information about possible Leadership Derailers. If emotional intelligence is positively related to transformational leadership, are there any subscales that, if lacking, relate to leadership derailment? To answer this question, EQ-i 2.0 subscale scores were correlated with the Laissez-Faire score. Laissez-Faire leaders demonstrate avoidance of responsibility and action; they are essentially leaders by the nature of their position in the organization, and not by their presence, ability to motivate, or positive impact that they have on others. Research has shown that this type of non-leadership is, at a minimum, not related to positive outcomes (e.g., Judge & Piccolo, 2004) and, at most, destructive—contributing to distress, role ambiguity, and conflict (Skogstad et al., 2007). As predicted, the EQ-i 2.0 showed strong negative correlations with Laissez-Faire leadership. Correlations ranged from -.50 for Problem Solving to -.20 for Empathy and Social Responsibility (see Table E.5). A negative correlation here suggests that as Emotional Intelligence increases, the risk of avoiding leadership responsibilities decreases.
Lower scores in any EQ-i 2.0 subscale may make it more difficult for a leader to be inspirational, visionary, innovative, and able to motivate their team to outperform expectations. Lower scores across the profile may suggest your client tends to avoid leadership responsibilities or derails from influential positions of leadership.
Although all subscales are important to prevent leadership derailment, to provide development focus, four subscales were chosen to appear in the Leadership Derailers section due to their stronger connection to leadership derailment (Laissez-Faire leadership). These four subscales were chosen based on both practical significance and statistical importance:
- - Impulse Control
- - Stress Tolerance
- - Problem Solving
- - Independence
Creating the Leadership Bar
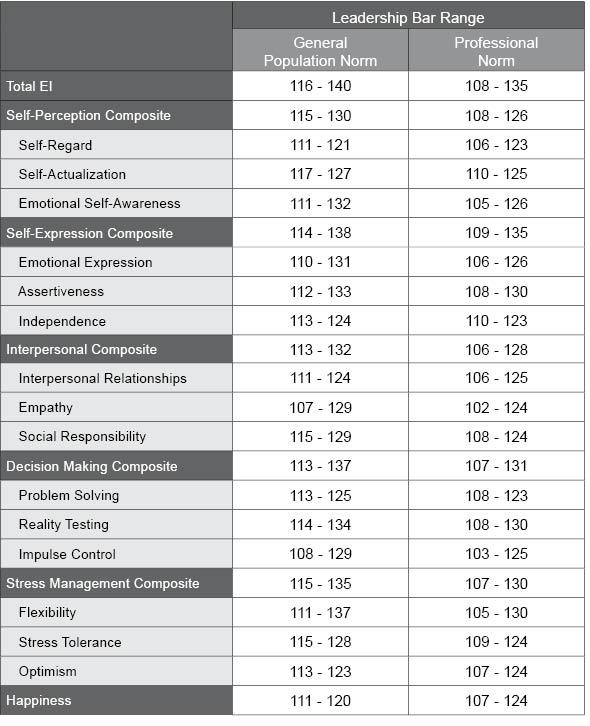
Should you choose, you can compare your clients’ results to those of the top leaders in the leadership sample. Only the top leaders, those scoring in the top 50% of our sample on the EQ-i 2.0, were included in this comparison group. As an administrator, this means your client is being compared to those exceptional leaders who demonstrate high EI, and not just to any leader. A bar indicating the range of these top leaders’ scores is plotted against your client’s scores. Table E.6 presents the range of standard scores for the Leadership Bar.
Table E.6. EQ-i 2.0 Leadership Bar Ranges