Appendix E: EQ-i 2.0 Leadership Report
This appendix presents the statistical results pertaining to the EQ-i 2.0 Leadership Report.
- Table E.1. Demographic Characteristics of the Leadership Sample
- Table E.2. EQ-i 2.0 Scores of Leaders as Compared to the Norm Group
- Table E.3. Comparison of EQ-i 2.0 Scores in Transformational and Transactional Leaders
- Table E.4. Correlations Between EQ-i 2.0 and Leadership Dimensions
- Table E.5. Correlation of EQ-i 2.0 Scores and Laissez-Faire Leadership Style
- Table E.6. EQ-i 2.0 Leadership Bar Ranges
Table E.1. Demographic Characteristics of the Leadership Sample
The following table summarizes the demographic characteristics of the leadership sample. This sample includes leaders representing a wide range of demographic groups.
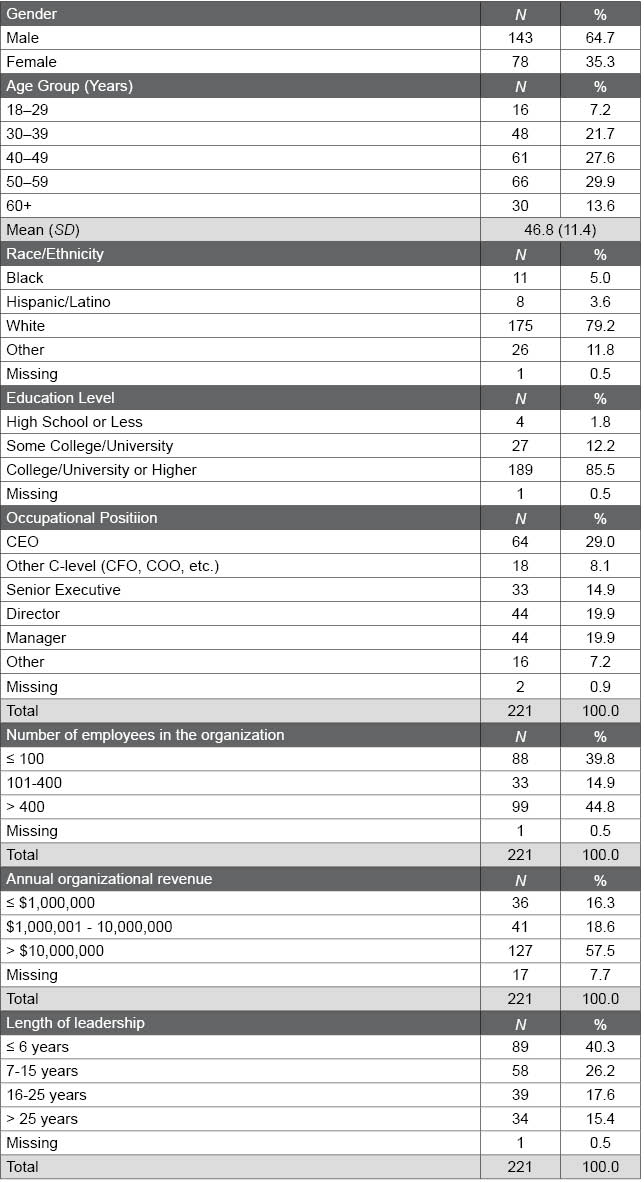
Table E.2. EQ-i 2.0 Scores of Leaders as Compared to the Norm Group
The following table displays the means and standard deviations of the EQ-i 2.0 Total EI score, composite scales, and subscales in the leadership sample. d values provide an effect size to describe the difference between leaders’ scores and those in the normative sample (M = 100, SD =15) as small, medium, or large. The meaningfully higher scores (i.e., d ≥ 0.20) found in leaders relative to the normative sample supports the validity of the EQ-i 2.0.
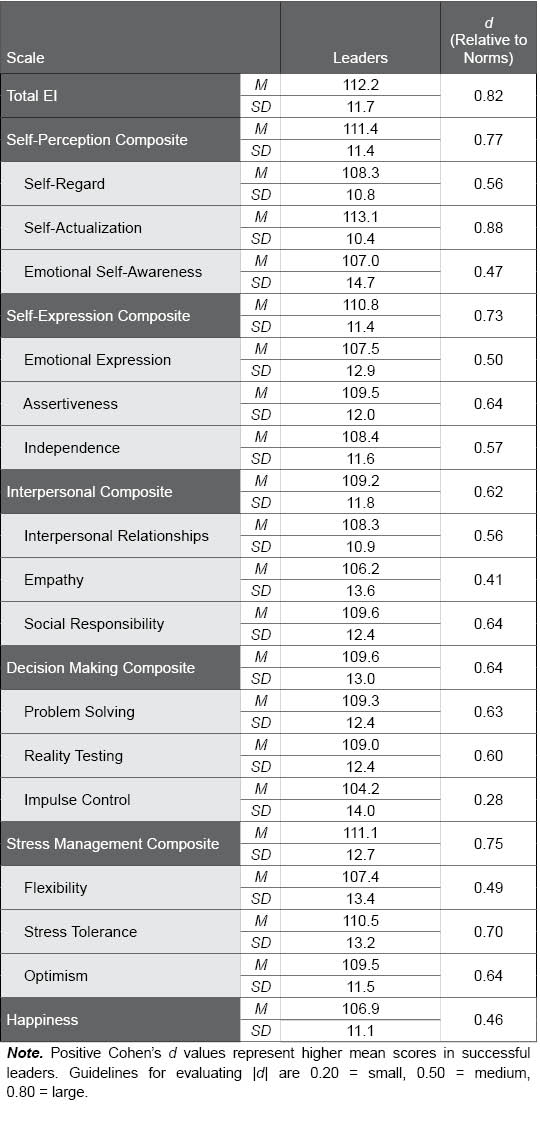
Table E.3. Comparison of EQ-i 2.0 Scores in Transformational and Transactional Leaders
The following table displays the means and standard deviations of transformational versus transactional leaders on the EQ-i 2.0 Total EI score, composite scales, and subscales. d values provide an effect size to describe the difference between transformational leaders’ scores and those in the transactional leadership sample (M = 100, SD = 15) as small, medium, or large. The meaningfully higher scores (i.e., d ≥ 0.20) found in transformational relative to transactional leaders provides preliminary validation for the hypothesis that leaders whose approach values transforming and growing their teams have higher levels of EI than those who are more transactional in nature.
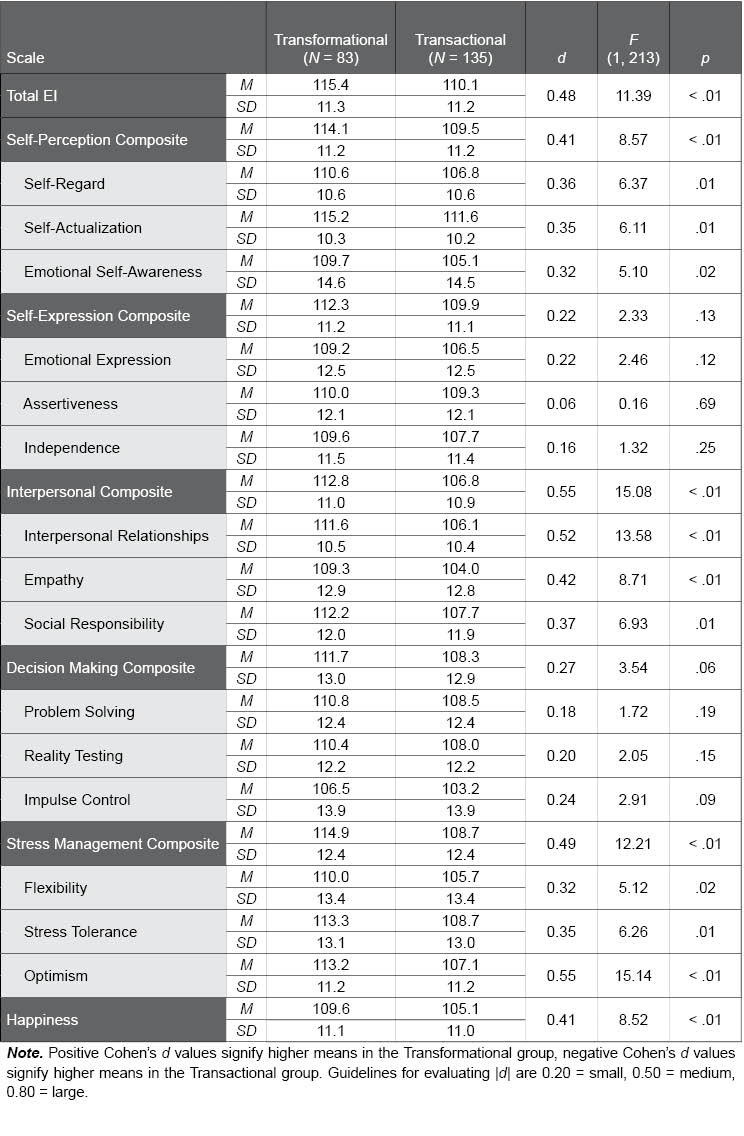
Table E.4. Correlations Between EQ-i 2.0 and Leadership Dimensions
The following table illustrates the correlations among the EQ-i 2.0 scales and the leadership dimensions shown in the leadership report. In order to validate that these leadership dimensions are associated with EI, the corresponding MLQ scales of Idealized Influence*, Inspirational Motivation, Intellectual Stimulation and Individual Consideration (respectively), were used in a correlation analysis. With the exception of Impulse Control, all EQ-i 2.0 scores correlated strongly with all transformational leadership characteristics.
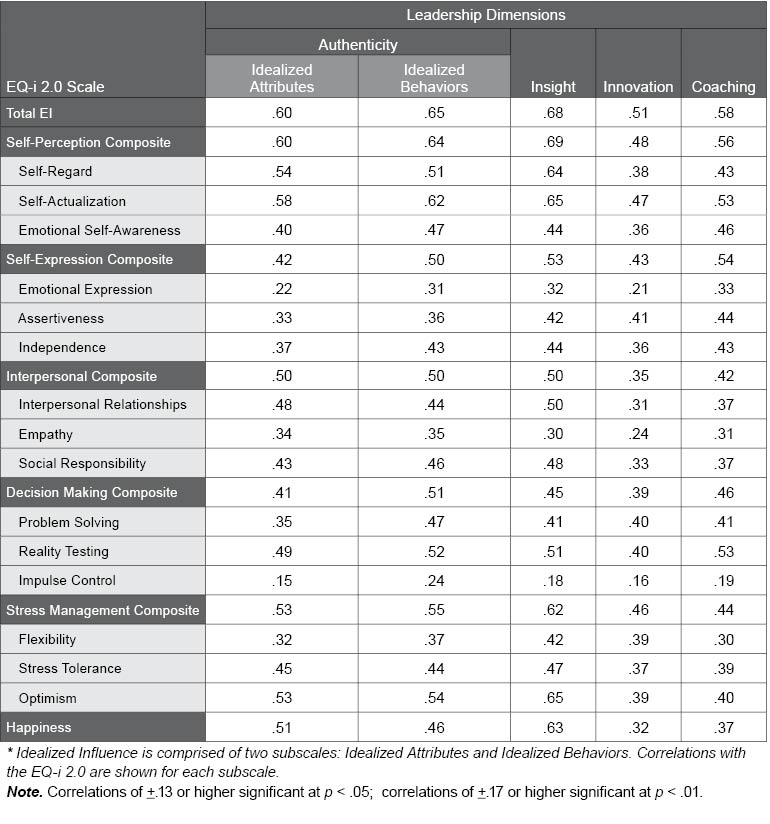
Table E.5. Correlation of EQ-i 2.0 Scores and Laissez-Faire Leadership Style
The following table illustrates the correlations among the EQ-i 2.0 scales and Laissez-Faire Leadership Style, used to represent leadership derailment in the leadership report. As predicted, the EQ-i 2.0 showed strong negative correlations with Laissez-Faire leadership. Correlations for the EQ-i 2.0 subscales ranged from -.50 for Problem Solving to -.20 for Empathy and Social Responsibility.
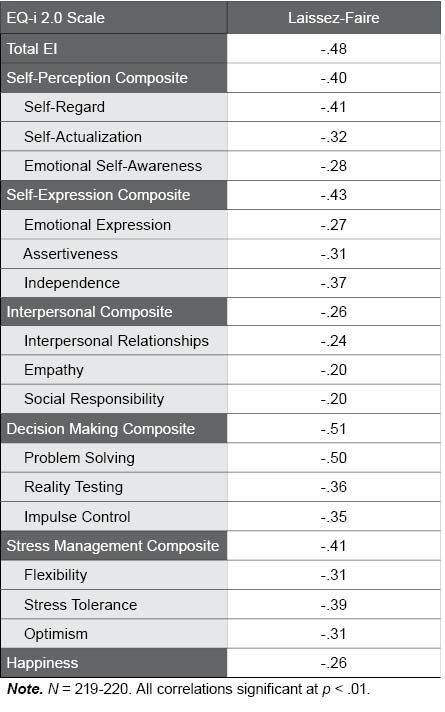
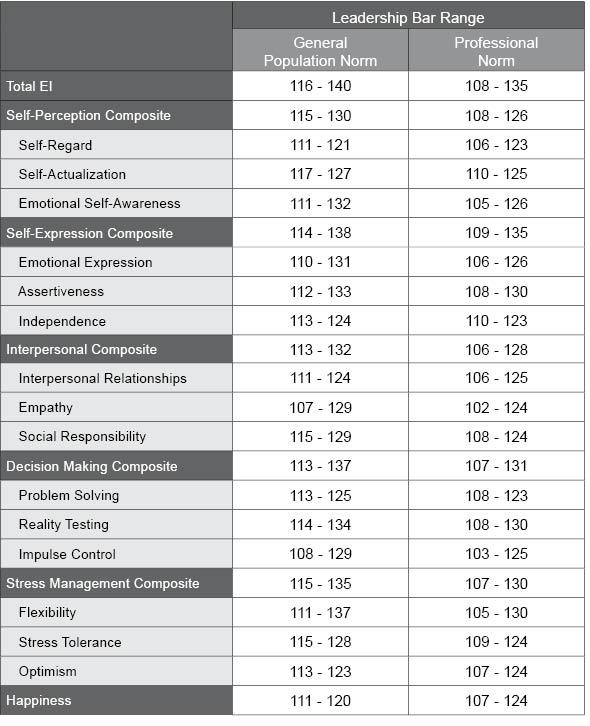
Table E.6. EQ-i 2.0 Leadership Bar Ranges
The following table shows standard score ranges used to create leadership bars for the composite scales and subscales. Leadership bar ranges for the General Population and Professional Normative samples are displayed separately.
