Appendix E: EQ-i 2.0 Leadership Report
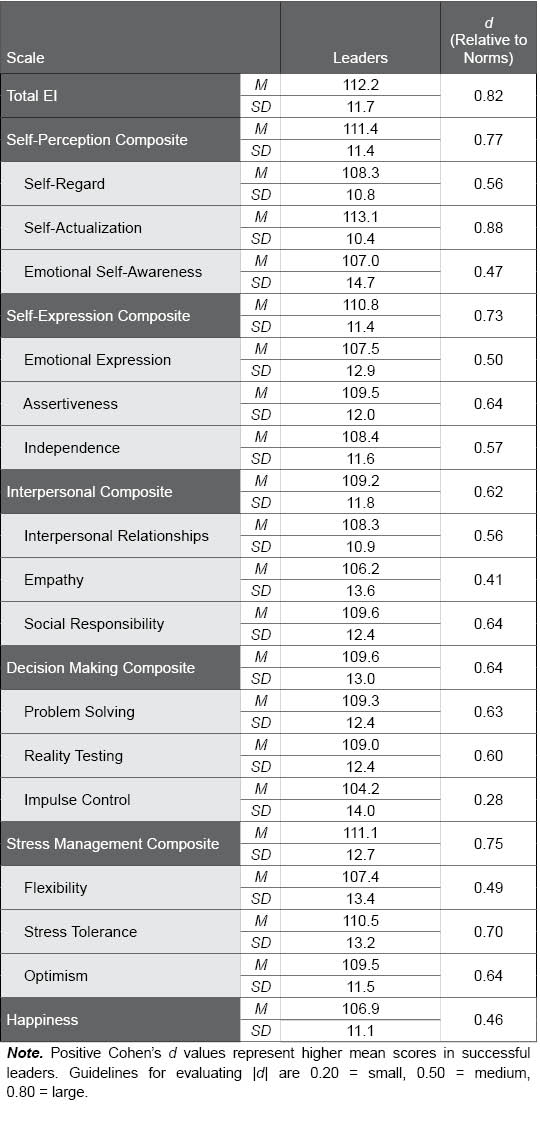
Table E.2. EQ-i 2.0 Scores of Leaders as Compared to the Norm Group
The following table displays the means and standard deviations of the EQ-i 2.0 Total EI score, composite scales, and subscales in the leadership sample. d values provide an effect size to describe the difference between leaders’ scores and those in the normative sample (M = 100, SD =15) as small, medium, or large. The meaningfully higher scores (i.e., d ≥ 0.20) found in leaders relative to the normative sample supports the validity of the EQ-i 2.0.