Appendix E: EQ-i 2.0 Leadership Report
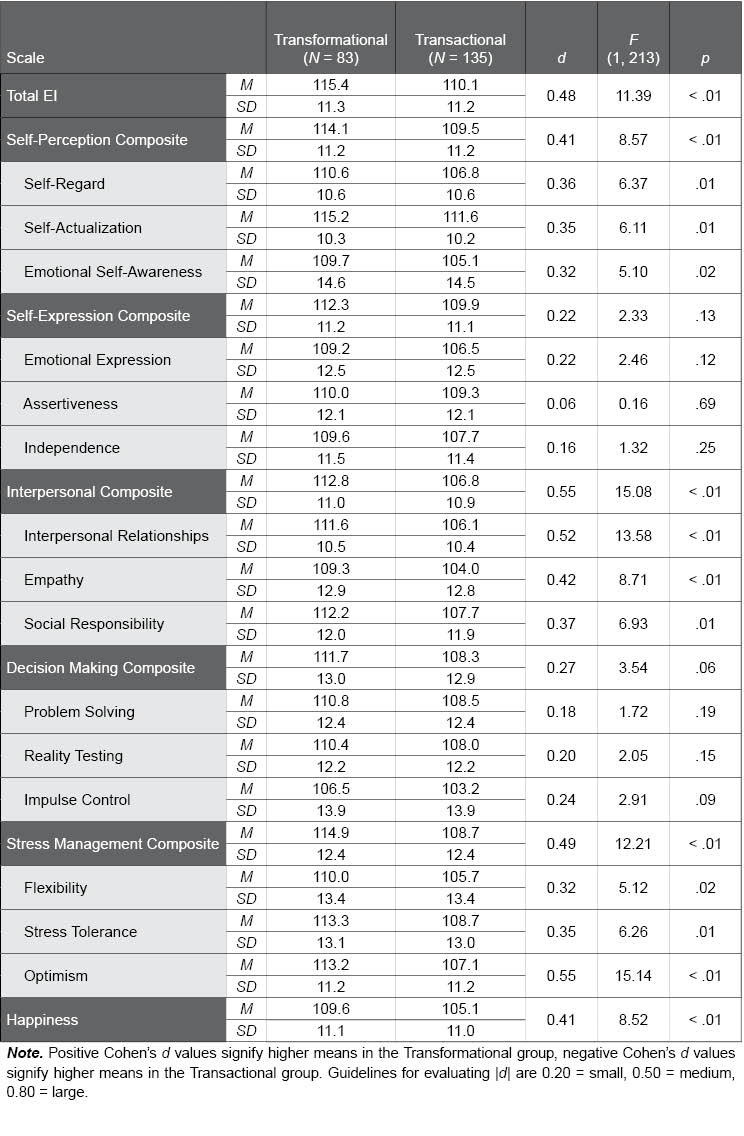
Table E.3. Comparison of EQ-i 2.0 Scores in Transformational and Transactional Leaders
The following table displays the means and standard deviations of transformational versus transactional leaders on the EQ-i 2.0 Total EI score, composite scales, and subscales. d values provide an effect size to describe the difference between transformational leaders’ scores and those in the transactional leadership sample (M = 100, SD = 15) as small, medium, or large. The meaningfully higher scores (i.e., d ≥ 0.20) found in transformational relative to transactional leaders provides preliminary validation for the hypothesis that leaders whose approach values transforming and growing their teams have higher levels of EI than those who are more transactional in nature.