


UK and Ireland Norms
The release of the United Kingdom (UK) and Ireland Norm provides users with the ability to score their clients against data collected from these countries. This chapter is designed to provide normative and psychometric information particular to populations in the UK and Ireland, and does not constitute a revision to the EQ-i 2.0 or EQ 360 2.0 assessments, published in 2011. The assessments remain unchanged, but additional normative samples are now available (the original North American normative samples are described in detail in Standardization, Reliability, and Validity).
| This chapter describes the development of the EQ-i® 2.0 and EQ 360 2.0 UK and Ireland Norm samples. For information on the EQ-i 2.0, including administration, interpretation, or development of the North American Norm, please refer to Parts I–V of the EQ-i 2.0 User’s Handbook. |
The first section of this chapter is devoted to the development, standardisation, reliability, and validity of the EQ-i 2.0 UK and Ireland Norm, followed by a section describing these same properties for the EQ 360 2.0 UK and Ireland Norm.
As with the North American Norm, two normative options are available for scoring the EQ-i 2.0 UK and Ireland: (1) a General Population Norm, and (2) a Professional Norm. The release of both options provides users in the UK and Ireland with increased flexibility in the use of the EQ-i 2.0. These new features were created based on rigorous science and with customer needs in mind. General Population norms have the widest scope and allow for comparisons to norms reflecting the average person in the UK and Ireland. Professional norms allow consultants the option of using a norm that is more relevant to the people they work with every day: working professionals. This chapter describes how these new norm groups were created to provide consultants with additional options to enrich their work.
This General Population Norm includes 1,450 individuals, and is used to compare your client’s score to the general UK and Ireland population, and is representative of the age, gender, ethnicity, and education compositions of UK and Ireland. (See Standardisation under EQ-i 2.0 UK and Ireland Standardisation for more information on the sample characteristics.) In essence, using the General Population Norm to compare your client’s score to the average person's score on the EQ-i 2.0 is the broadest comparison you can make. Such comparisons help you answer the following question: “How does my score compare to typical people in the UK and Ireland?” This norm would include both working and non-working individuals, people with high and low education levels, etc.
Within the UK and Ireland General Population Norm, there is both an Overall General Population Norm and Age and Gender Specific norm groups. Age and Gender Specific norm groups allow you to compare your client to a UK and Ireland norm group within your client’s gender and age range. If you use the Overall norm, the normative comparison will not be affected by the individual’s age or gender (for example, a 43-year-old female will be compared to all individuals in the UK and Ireland General Population Norm sample regardless of their age or gender). If you use the Age and Gender Specific norm, then the comparison will be made only to individuals of the same gender and age group (for example, a 43 year-old female will only be compared to females who are 40–49 years of age).
There are sound reasons for using either of these options, and the choice ultimately belongs with the preference of each consultant. Some consultants prefer not to use the age and gender specific norms so that everyone can be scored against the same norm values (Overall General Population of UK and Ireland). On the other hand, other consultants like the specificity of comparing individuals directly to those that are most similar in age and gender (Age and Gender Specific General Population of UK and Ireland).
Sometimes you or your client may want a more specific comparison. For instance, you may want to compare your client to other similar individuals, such as other professionals. The Professional Norm enables you to do just that: it allows you to compare your client’s score to professionals in UK and Ireland rather than to the average person from UK and Ireland.
Similar to the UK and Ireland General Population Norm, there is both a UK and Ireland Overall Professional Norm, and a UK and Ireland Professional Norm that is broken down into Age and Gender Specific norm groups. If you use the Overall norm, the normative comparison will not be affected by the individual’s age or gender (for example, a 48-year-old male will be compared to all professionals in the UK and Ireland Professional Norm sample regardless of their age or gender). If you use the Age and Gender Specific norm, then the comparison will be made only to UK and Ireland professionals of the same gender and age group (for example, a 48-year-old male will only be compared to males from UK and Ireland who are 40–49 years of age).
Again, there are sound reasons for using either of these options, and the choice ultimately belongs with the preference of each consultant. Some consultants prefer not to use the age and gender specific norms so that everyone is scored against the same norm values (Overall Professional Norm). On the other hand, other consultants like the specificity of comparing individuals directly to those that are most similar in terms of age and gender (Age and Gender Specific Professional Norm).
The Professional Norm sample includes 1,150 individuals from the UK and Ireland who are employed or self-employed and have a high level of educational attainment (i.e., in the UK, qualifications were degree [e.g., BA, BSc] or higher [e.g., MA, PhD], and in Ireland, the highest level of educational attainment was Third Level degree or higher). In other words, these norms reflect the individuals you will most commonly encounter in consultancy in professional contexts in the UK and Ireland. (See Standardisation under EQ-i 2.0 UK and Ireland Standardisation for more information on the sample characteristics.)
The Professional Norm sets the bar higher for your client’s EQ-i 2.0 scores; this norm group is more educated and more representative of corporate and/or managerial employees than the General Population Norm.
If you are administering the EQ-i 2.0 to an individual who you consider to be a professional, selecting the Professional Norm option when generating your report is appropriate in most cases. Selecting the UK and Ireland Professional Norm option means that you are comparing your client’s score to other similar individuals (professionals) in the UK and Ireland. Your client's work environment is likely made up of professionals, and he/she is likely to be gauged against other professionals when applying for jobs and promotions, as well as when considering development and other career related opportunities.
Scoring a client’s EQ-i 2.0 results with the Professional Norms will generally result in lower scores than those obtained using the General Population Norms. The decrease is not always the same from one subscale to the next or from one score to the next.
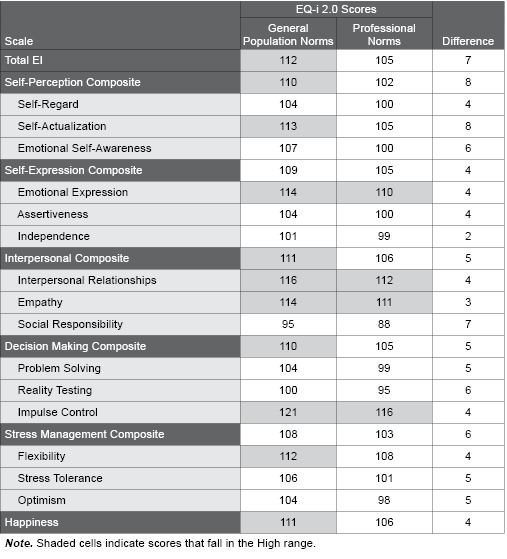
Example 1 illustrates the effect on scores of using the different norm groups for Ann, a 30-year-old Management Consultant based in London, England. When Ann’s coach scored her EQ-i 2.0 results with the UK and Ireland General Population Norms, many scores were in the High range (i.e., ≥ 110), including the Total EI score. This means that when Ann is compared to the general UK and Ireland population, she has emotional intelligence that is higher than typical. In contrast, when Ann’s coach re-scored her EQ-i 2.0 results using the UK and Ireland Professional Norms, her scores mostly fell in the Average range (her scores decreased by 2 to 8 points, depending on the scale). This means that Ann’s emotional intelligence is fairly typical when compared to other professionals in UK and Ireland.
Example 1. Ann's EQ-i 2.0 Scores Using Overall General Population and Overall Professional Norms
This section describes the psychometric properties of the UK and Ireland norms for the EQ-i 2.0, including standardisation, reliability, and validity. The first section is devoted to the standardisation, reliability, and validity of the EQ-i 2.0 General Population Norm sample, followed by a section describing these same properties for the EQ-i 2.0 Professional Norm sample.
| All tables and figures representing detailed depictions of the analyses described in this chapter are available in Appendix C. |
EQ-i 2.0 UK and Ireland General Population Norm
Standardisation
NORMATIVE SAMPLE
Normative data for the UK and Ireland General Population Norm sample (N = 1,450) were collected in October and November of 2011.
The demographic composition of the normative sample is shown in Tables C.1–C.4. The General Population Norm sample was collected across five age ranges, evenly proportioned by gender within each age interval. The normative sample is very close to UK and Ireland Census targets in terms of race/ethnicity and geographic region. Education level targets, however, deviated somewhat from Census targets; therefore, the normative samples were statistically weighted in order to create a sample that more closely matched Census targets. The weighted normative sample, and therefore the reference group against which EQ-i 2.0 scores are compared, can be considered representative of the UK and Ireland general populations. In terms of employment status, 85.4% of the sample were employed or self-employed, 2.0% were unemployed, 11.2% were retired, and 1.4% indicated “other”.
NORMING PROCEDURES
The first step in the preparation of the UK and Ireland norms was to determine if any age or gender trends existed in the data. Large differences in scores between men and women, or across various age groups, would suggest a need to create an option for separate gender- or age-based norm groups. Conversely, a lack of such differences may dictate the use of a single norm group with genders and age groups combined.
A series of analyses of covariance (ANCOVA; for the Total EI score) and multivariate analyses of covariance (MANCOVA; for the composites and subscales) were used to examine the relationships between gender and age with EQ-i 2.0 scores. Education level and race/ethnicity were used as covariates in order to control for the effects of these demographic variables. In an attempt to control for Type I errors that might occur with multiple analyses, a more conservative criterion of p < .01 was used for all F-tests.
The Wilks’ lambda statistic generated from these analyses ranges from 0.00 to 1.00 and conveys the proportion of variance that is not explained by the effect (gender, age, or the interaction between gender and age) in the multivariate analyses. These values were all close to 1.00, suggesting that only a small amount of variance could be explained by the effects of these variables. However, F-tests revealed significant effects of gender, age, and the interaction of gender and age (see Table C.5). Given these results, the univariate effects are described in detail below.
Gender Effects. Results of the gender analyses showed that males and females did not differ significantly on the Total EI score, indicating that overall emotional intelligence as measured by the EQ-i 2.0 is the same for males and females. However, small to medium effects were seen on a number of scales (see Table C.6 for effect sizes and Table C.7 for descriptive statistics and significance test results), with a pattern quite similar to what was observed with the North American normative sample (see Standardization, Reliability, and Validity for more information on North American results). The largest gender difference seen in the UK and Ireland sample was on Empathy, with women scoring higher than men with a moderate effect size (d = -0.67). Smaller differences were found with women scoring higher than men on the Interpersonal Composite (d = -0.49), Emotional Self-Awareness (d = -0.45), Emotional Expression (d = -0.35), and Interpersonal Relationships (d = -0.30). Men scored higher than women with small effect sizes on Problem Solving (d = 0.28), Stress Tolerance (d = 0.21), and Independence (d = 0.25).
Age Effects. Significant but small effects were found across age groups for most scales. See Table C.6 for effect sizes and Table C.8 for descriptive statistics and significance test results. Though patterns across the age groups were not consistent across scales, scores were generally lowest for the 18–29 year-old age group and highest for the 60+ age group, showing a clear pattern of increases in EI with age. Differences between adjacent age groups were typically only a few standard score points in magnitude, but differences between the 50–59 year-old group and the 60+ group were larger for some scales. On some scales (Social Responsibility, Problem Solving, and Reality Testing), differences of up to 9 standard score points were observed between the youngest and oldest groups. Emotional Expression and Impulse Control were the only subscales that failed to show at least a small effect size.
Gender × Age Interaction. For most scales, interaction effects were not observed between age and gender. Only two scales reached significance, and met the minimum partial η2 criterion for a small effect size. For the Stress Management composite, males scored higher than females in the 18–29 year-old group, but for the 50–59 year-old group it was the females who scored higher. For Flexibility, a larger gender difference was seen in the 50–59 year-old group (with females scoring 6 standard score points higher) compared to the other age groups. Overall, however, age effects were largely consistent across males and females, and any gender effects were consistent across age groups.
Norm Groups and Norm Construction. Overall, similar to what was found in the North American Norm sample, the age and gender analyses revealed significant, but relatively small effects. Therefore, specific Age and Gender Professional Norms, as well as an Overall Professional Norm (i.e., collapsed across ages and genders), were both developed. Results revealed that skewness and kurtosis values were close to 0 (skewness values ranged from -0.77 to 0.00; kurtosis values ranged from -0.38 to 0.53), and an examination of the scale histograms did not reveal any significant departures from a bell-shaped (Guassian) curve. A histogram for the EQ-i 2.0 UK and Ireland Total EI score is provided in Figure C.1. This figure displays the shape of the distribution for the Total EI score. The shapes of the distributions for the other scales are comparable to this one. Since the data closely match a bell-shaped curve, artificial transformation of scores was deemed unnecessary. Actual construction of the norms was conducted in the same manner as the North American Norms, including the use of statistical smoothing (see Standardization, Reliability, and Validity for more information on the construction of the North American General Population Norm).
Comparison of UK and Ireland General Population Norms to North American General Population Norms. The UK and Ireland sample was compared against the North American normative sample by computing standard scores for the EQ-i 2.0 scales with the North American norms, and comparing these scores against a mean of 100. Overall, no difference between the UK and Ireland sample and the North American norms was observed on the Total EI score. Although for a number of scales the effects did reach statistical significance because of the large sample size being used, all differences were within 3 standard score points, and none reached a meaningful effect size (all Cohen’s d values were below 0.20). Results are presented in Table C.9.
Internal Consistency
Internal consistency, a measure of reliability, conveys the degree to which a set of items are associated with one another. High levels of internal consistency suggest that the set of items are measuring a single, cohesive construct. Internal consistency is typically measured using Cronbach’s alpha (Cronbach, 1951). Cronbach’s alpha ranges from 0.0 to 1.0 and is a function of both the interrelatedness of the items in a test or scale and the length of the test (John & Benet-Martinez, 2000). Higher values reflect higher internal consistency.
Cronbach’s alpha values for the EQ-i 2.0 scales for the UK and Ireland normative sample are presented in Table C.10. Although there is no universal criterion for a “good” alpha level, informal cutoffs for evaluating alpha are typically .90 is “excellent”, .80 is “good”, .70 is “acceptable”, and lower than .70 are “questionable”. Most of the values found in Table C.10 demonstrate excellent or good reliability, and these values are particularly favourable given the small number of items included in most subscales. For the overall sample, the alpha value of the Total EI scale was .97, values for the composite scales ranged from .86 to .92, and values were .75 or higher for all subscales. Similar patterns were seen across the age and gender normative groups, including a Total EI alpha value of .96 or higher for each normative group. The high level of internal consistency found in the Total EI score supports the idea that the EQ-i 2.0 items are measuring a single cohesive construct, namely emotional intelligence. The same can be said of the individual components of emotional intelligence that make up the EQ-i 2.0 (i.e., the composites and subscales).
Factor Validity
EXPLORATORY FACTOR ANALYSIS
Exploratory factor analysis (EFA) was used to determine whether the subscales established with the North American EQ-i 2.0 normative data empirically emerge from the UK and Ireland normative dataset. Five EFAs were conducted, analysing the items within each composite scale separately. In each EFA, a three-factor solution was forced to examine whether the items corresponding to each subscale within the composite also loaded together in the UK and Ireland normative data. As with the North American normative data, principal axis factoring extraction was used, with direct oblimin (i.e., oblique) rotation, as the factors within each composite are expected to correlate with each other. Reverse scoring was applied to relevant items prior to the analysis. Factor loadings were considered significant if they reached at least ± .30, and an item was defined as cross-loading if it was significant on more than one factor and had loadings within .10 of each other on these factors.
For the Self-Perception Composite EFA, items for the Self-Regard, Emotional Self-Awareness, and Self-Actualisation subscales loaded together as expected by the established factor structure. All items loaded significantly onto their respective factors, with no cross-loadings. For the Self-Expression Composite EFA, all items loaded significantly onto their respective factors for the Independence, Emotional Expression, and Assertiveness subscales. Two items also cross-loaded with other factors: one Emotional Expression item cross-loaded onto Independence, and one Independence item cross-loaded onto Assertiveness. For the Interpersonal Composite EFA, items for the Empathy, Interpersonal Relationships, and Social Responsibility subscales all loaded significantly onto their respective factors with no cross-loadings. For the Decision Making Composite EFA, although most of the Problem Solving, Impulse Control, and Reality Testing items loaded significantly onto their respective factors with no cross-loadings, there were a few exceptions. One Reality Testing item cross-loaded with Problem Solving, and factor loadings for two Impulse Control items fell slightly below the cutoff of ± .30 (i.e.,.29 and .28). For the Stress Management Composite EFA, other than a single Optimism item that cross-loaded with Flexibility, all other Optimism, Flexibility, and Stress Tolerance items loaded significantly onto their respective factors with no cross-loadings.
To summarise, the EFAs generated solutions that strongly correspond to the established EQ-i 2.0 factor structure, with the items for each subscale empirically grouping together onto the expected factors. Of the 126 items entered in the EFAs, only four items showed cross-loadings, and only two items fell just below significance criteria for the factor loadings.
CORRELATIONS AMONG EQ-i 2.0 COMPOSITE AND SCALES AND SUBSCALES
Correlations among the EQ-i 2.0 composite scales and subscales were examined to determine the degree of cohesiveness among them. It is expected that these correlations will generally be high, given that they are all measuring the same underlying construct of emotional intelligence, but they should not be so high as to indicate redundancy between the scales. Correlations observed in the UK and Ireland normative sample are presented in Tables C.11 (composite scales) and C.12 (subscales). These results are similar to what is seen with the North American normative sample.
The composite scale correlations ranged from r = .40 (Interpersonal/Decision Making) to r = .75 (Self-Perception/Stress Management). For the subscales, the correlations ranged from r = .19 (Reality Testing/Impulse Control) to r = .65 (Self-Regard/Self-Actualisation). These results support the notion that a single, underlying dimension is being represented in the EQ-i 2.0, yet the values are not overly high and there is enough variation in the correlations to provide clear evidence for the multidimensional nature of the assessment.
EQ-i 2.0 UK & Ireland Professional Norm
Standardisation
NORMATIVE SAMPLE
Collection of data for the UK and Ireland EQ-i 2.0 Professional Norm sample took place between October 2011 and March 2012. The UK and Ireland Professional Norm sample includes 1,150 individuals (N = 1,035 [90%] from the UK, and N = 115 [10%] from Ireland). The sample includes an equal number of men and women, with a good spread across the age groups (see Table C.13 for the age and gender distribution of the sample). The individuals in this sample were all employed or self-employed, and worked in a variety of professional occupations (see Table C.14 for a breakdown of employment areas).
NORMING PROCEDURES
The first step in preparation of the norms was to determine if any age or gender trends existed in the data. Large differences in scores between men and women, or across various age groups, would suggest a need to create and option for separate gender or age-based norm groups. Conversely, a lack of such differences may dictate the use of a single norm group with genders and age groups combined.
A series of analyses of covariance (ANCOVA; for Total EI) and multivariate analyses of covariance (MANCOVA; for the composites and subscales) was used to examine the relationships between gender and age with EQ-i 2.0 scores. In an attempt to control for Type I errors that might occur with multiple analyses, a more conservative criterion of p < .01 was used for all F-tests.
The Wilks’ lambda statistic generated from these analyses ranges from 0.00 to 1.00 and conveys the proportion of variance that is not explained by the effect (gender, age, or the interaction between gender and age) in the multivariate analyses. These values were all close to 1.00, suggesting that only a small amount of variance could be explained by the effects of these variables. However, F-tests revealed significant effects of gender and age for both the composite scale and subscale analyses (see Table C.15). Given these results, the univariate effects are described in detail below.
Gender Effects. Results of the gender analyses showed that males and females did not differ significantly on the Total EI score, indicating that overall emotional intelligence as measured by the EQ-i 2.0 is the same for males and females; however, small to medium effects were found for some composite scales and subscales (see Table C.16 for effect sizes and Table C.17 for descriptive statistics and significance test results). The largest difference was on Empathy, with women scoring higher than men with a moderate effect size (d = -0.54). Smaller differences were found with women scoring higher than men on the Interpersonal Composite (d = -0.40) as well as the Emotional Self-Awareness (d = -0.36), Emotional Expression (d = -0.35), and Interpersonal Relationships (d = -0.23) subscales. Small effects were found with men scoring higher than women on the Self-Regard (d = 0.25), Independence (d = 0.23), Problem Solving (d = 0.28), and Stress Tolerance (d = 0.28) subscales.
Age Effects. Results of the age analyses revealed small effects of age on EQ-i 2.0 scores for most scales (see Table C.16 for effect sizes and Table C.18 for descriptive statistics and significance test results). Although score patterns across age groups did differ slightly between scales, the typical pattern was an increase in scores with age. For the majority of scales, the lowest scores were observed in the 18–29 year-old group, and the highest scores were seen in the 50+ group.
Gender × Age Interactions. There were no significant interactions between age and gender, and partial η2 values all fell below .01 (see Table C.16), indicating that age effects were consistent within males and females, and any gender effects were consistent across age groups.
Norm Groups and Norm Construction. Overall, similar to what was found in the UK and Ireland General Population Norm sample, the age and gender analyses revealed significant but relatively small effects. Therefore, both specific Age and Gender Professional Norms as well as an Overall Professional Norm (i.e., collapsed across ages and genders) were developed. Also similar to results found with the UK General Population Norm sample, skewness and kurtosis values were not large enough to suggest a normalising transformation was necessary for the EQ-i 2.0 scores in the UK and Ireland Professional Norm sample (skewness values ranged from -1.08 to -.23; kurtosis values ranged from -.29 to 1.59). A histogram for the EQ-i 2.0 Total EI score is provided in Figure C.2. The shape of the scores for the Total EI score is comparable to the shape of the scores for the other scales. Actual construction of the norms was conducted in the same manner as the North American Norms, including the use of smoothing techniques (see Standardization, Reliability, and Validity for more information on the construction of the North American General Population Norm).
Comparison of UK and Ireland Professional Norms to North American Professional Norms. The UK and Ireland Professional Norm sample was compared against the North American Professional Norm sample by computing standard scores for the EQ-i 2.0 scales with the North American Professional norms, and comparing these scores against a mean of 100. The UK and Ireland Professional Norm sample scored lower than the North American Professional Norm sample on all but two scales, and although most scales did reach statistical significance, meaningful effect sizes (i.e., |d| ≥ 0.20) were obtained for five of the scales. All differences were within 5 standard score points. Results are presented in Table C.19.
Internal Consistency
Cronbach’s alpha values for the UK and Ireland EQ-i 2.0 Professional Norm sample are presented in Table C.20. Most values shown demonstrate excellent or good reliability. For the overall sample, the alpha value of the Total EI scale was .97, values for the composite scales ranged from .87 to .92, and values were .77 or higher for all subscales. Similar patterns were seen across the age and gender normative groups, including a Total EI alpha value of .96 or higher for each normative group. The high level of internal consistency found in the Total EI score supports the idea that the EQ-i 2.0 items are measuring a single cohesive construct, namely emotional intelligence.
Comparing the General Population and Professional Norm Groups
Because the individuals in the Professional Norm sample have professional careers and are more educated than those in the General Population Norm sample, it was hypothesised that the professionals should score higher than the general population. In order to test this expectation, the UK and Ireland Professional Norm sample data were scored using the UK and Ireland General Population norms. As expected, the Professional Norm sample scored between 2.2 and 8.7 standard score points higher than the General Population sample across the EQ-i 2.0 scales (mean difference = 5.1 standard score points); results are presented in Table C.21.
Large Scale Analysis of Professional Norms
In order to determine what the distribution of scores from UK and Ireland EQ-i 2.0 customers would look like when scored with the Professional Norms, data from a sample of 615 customers (collected from June 2011 to February 2012) were scored using the UK Professional Norms (see Table C.22). Individuals in this sample came from both the UK (69.3%) and Ireland (30.7%). The sample was 51.1% male, 37.4% female, and 11.5% did not indicate their gender. The customers’ age ranged from 19 to 68 years (M age = 40.9; SD = 8.0 years). Results from this sample revealed that when using the Professional Norms, the average scores were close to 100 (M = 100.6 to 103.3), and the standard deviations were close to 15 (SD = 13.6 to 15.5). Furthermore, skewness and kurtosis values for this sample were small; skewness values ranged from -1.02 to -0.14, and kurtosis values ranged from -0.42 to 2.07 (with only one value above 1.1), indicating that the distribution of most scores approximates a bell-shaped (Gaussian) curve. These values, combined with an examination of the scale histograms, indicate a slight negative skew, with no significant departures from a bell-shaped (Guassian) curve (see Figure C.3 for the Total EI score histogram for this sample of customers).
The release of the UK and Ireland Norm for the EQ 360 2.0 provides users with the ability to score their clients against data collected from these countries. Research has found that self and others’ ratings are influenced by cultural characteristics (Atwater et al., 2009). Further, the discrepancy in self-observer ratings can be predicted by cultural values (Eckert et al., 2010). The UK and Ireland General Population norm for the EQ 360 allows consultants to obtain 360 feedback scores that are more relevant to the UK and Ireland cultural characteristics. (The original North American normative sample for the EQ 360 is described in detail in Standardization, Reliability, and Validity.)
The following sections describe the psychometric properties of the UK and Ireland norms for the EQ 360 2.0, including standardisation, reliability, and validity.
| All tables and figures representing detailed depictions of the analyses described in this chapter are available in Appendix C. |
Standardisation
NORMATIVE SAMPLE
Collection of data for the UK and Ireland EQ 360 2.0 took place in October and November of 2011. Respondents (“the raters”) were required to rate an individual (“the ratee”) on the EQ 360 2.0 and provide demographic information about both themselves and the ratees. In order to create a representative normative sample, specific demographics regarding the ratees, guided by recent UK and Ireland Census information, were considered during the data collection procedures. Information was collected on each ratee’s gender, age group, race/ethnicity, employment status, and geographic region. For the EQ 360 2.0, this information about the ratee (i.e., the person being rated) was provided by the rater (i.e., the person completing the assessment). Information about the type (i.e., manager, work peer, direct report, or family/friend) and strength of the rater-ratee relationship was also collected (i.e., how long have they known each other, how well they know each other, and how often do they interact with each other).
Rater Description: The sample of 1,920 raters (i.e., the participants providing the ratings) was 58.5% male with a mean age of 46.1 years (SD = 13.0 years). The rater sample was primarily White (91.4%), and also included those that were Indian (2.2%), Black (1.9%), and of other races/ethnicities (4.5%). With regard to geographic region, the majority of the raters were from the UK (92.3%), and the remaining raters were from Ireland (7.7%). More than half of the raters (62.7%) had a university degree or equivalent/higher qualifications, many had some university or equivalent (20.8%), and the remaining raters had secondary school/GCSE grades A-C or less (16.6%). The majority of raters knew the ratee for longer than one year (see Table C.23), and more than half stated that they knew the ratee well or very well (57.7%; see Table C.24). More than half (59.4%) of the raters indicated that they interacted with the ratee very often (daily or almost daily; see Table C.25).
Ratee Sample: The normative sample was stratified to match the Census as closely as possible based on the ratees’ demographic characteristics. Table C.26 shows the ratee age group by gender distribution. The ratee sample included an equal ratio of males to females, stratified across four rater types: direct report (i.e., the ratee is the rater’s manager), manager (i.e., the ratee is the rater’s direct report), work peer, and friend/family member (see Table C.27). Race/ethnicity information for the ratee sample is presented in Table C.28 for each country. The majority of the normative sample was White, matching closely to Census proportions. The non-White group was composed of individuals described by the raters as mixed, Indian, Black, or other. Representation by geographic region is shown in Table C.29, with weighted percentages meeting Census targets for both countries within 1%.
NORMING PROCEDURES
Similar to the EQ-i 2.0, the first step in the EQ 360 2.0 norming procedure was to determine if any demographic trends existed in the UK and Ireland normative data. Large differences in scores between rater types (i.e., managers, work peers, direct reports, friends/family members) would suggest a need to create an option for separate rater-type norm groups, while a lack of such differences would suggest a need to create a single norm option with the rater-types combined. Similarly, large differences in scores between male and female ratees, or across various ratee age groups, would suggest a need to create an option for separate gender- or age-based norm groups. Conversely, a lack of such differences may dictate the use of a single norm group with genders and age groups combined. A series of analyses of covariance (ANCOVA; for the Total EI score) and multivariate analyses of covariance (MANCOVA; for the composites and subscales) were used to examine the relationships between rater-type, ratee gender, and age with EQ 360 2.0 scores. Ratee race/ethnicity (White vs. non-White) was included as a covariate in all analyses. In an attempt to control for Type I errors that might occur with multiple analyses, a more conservative criterion of p < .01 was used for all F-tests. Results at the multivariate level revealed significant effects of gender, age, and rater type for the composites and the subscales (see Table C.30). Interaction effects at the multivariate level were not significant. Given these results, the univariate effects are described in detail next.
Gender and age effects. Overall (and similar to what was seen with the North American EQ 360 2.0 data), gender and age effects were less pronounced in the EQ 360 2.0 normative sample than they were in the EQ-i 2.0 normative sample (see Table C.31 for effect sizes and Table C.32 and Table C.33 for descriptive statistics and significance test results).
None of the composites or the Total EI score reached even a small effect size for gender. At the subscale level, three subscales showed small effects (Emotional Self-Awareness, Emotional Expression, and Empathy), with females scoring higher than males.
With respect to age, only three scales reached a small effect size. For Independence, the effect was attributable to lower scores for the 18–29 year-old group, compared to all other age groups. For Flexibility, the 60+ group scored lower than the other groups. For Happiness, the youngest group scored higher than the other groups.
Rater type effects. No differences were observed across rater types for the Total EI score. At the composite and subscale level a number of scales showed differences between rater types, but these were mostly very small effects. For scales reaching at least a small effect size, direct reports provided the highest ratings compared to other rater groups on the Self-Expression composite and the Self-Regard, Assertiveness, Independence, and Problem Solving subscales, and provided the lowest ratings compared to other rater groups on the Interpersonal composite and the Interpersonal Relationships and Empathy subscales. See Table C.31 for effect sizes and Table C.34 for descriptive statistics and significance test results.
Interaction effects. None of the age × gender, age × rater type, or gender × rater type interactions reached even a small effect size at the univariate level.
Norm Groups and Norm Construction. Overall, the d and partial η2 values found in the normative data suggest negligible or very small effects of ratee gender, ratee age, and rater type. The scarcity of meaningful effects suggested that it was not necessary to create specific gender-, age-, or rater type-based norms for the UK EQ 360 2.0, and therefore only Overall norms were developed. These norms were created using the same procedure as the EQ-i 2.0 norms. Standard scores for all scales were computed with a mean of 100 and standard deviation of 15. Results revealed that skewness and kurtosis values were close to 0 (skewness values ranged from -0.78 to 0.05; kurtosis values ranged from -0.34 to 0.27), and an examination of the scale histograms did not reveal any significant departures from a bell-shaped curve. A histogram for the EQ 360 2.0 Total EI score is provided in Figure C.4. The other composite scales and subscales show comparable distributions. Therefore, artificial transformation of scores to fit normal distributions was deemed unnecessary.
Comparison of UK and Ireland Norms to North American Norms. The UK and Ireland sample was compared against the North American normative sample by computing standard scores for the EQ 360 2.0 scales with the North American EQ 360 2.0 norms, and comparing these scores against a mean of 100 (see Table C.35). Although for most scales the effects did reach statistical significance due to the large sample size, most differences were within 3 standard score points, and only three scales (Self-Perception composite, Self-Actualisation, and Emotional Expression) reached a meaningful effect size; for all other scales Cohen’s d values were below 0.20. The only scale on which the UK sample scored significantly higher than the North American sample was Assertiveness, but the effect size was negligible (d = 0.07).
Internal Consistency
Internal consistency conveys the degree to which a set of items are associated with one another. High levels of internal consistency suggest that the items are measuring a single, cohesive construct. Internal consistency is typically measured using Cronbach’s alpha (Cronbach, 1951), which ranges from 0.0 to 1.0 with higher values reflecting higher internal consistency.
Cronbach’s alpha values for the UK EQ 360 2.0 normative sample are displayed in Table C.36. Similar to results found with the North American EQ 360 2.0 data, most values ranged from good to excellent (.82 to .98) across the Total EI, composite, and subscale scores, with only Assertiveness reaching a lower, but still acceptable, level (.78).
Factorial Validity
EXPLORATORY FACTOR ANALYSIS
Exploratory factor analysis (EFA) was used to determine whether the subscales established with the North American EQ 360 2.0 normative data empirically emerge from the UK and Ireland normative dataset. Five EFAs were conducted, analysing the items within each composite scale separately. In each EFA, a three-factor solution was forced to examine whether the items corresponding to each subscale within the composite also loaded together in the UK and Ireland normative data. Principal axis factoring extraction was used, with direct oblimin (i.e., oblique) rotation, as the factors within each composite are expected to correlate with each other. Reverse scoring was applied to relevant items prior to the analysis. Factor loadings were considered significant if they reached at least ± .30, and an item was defined as cross-loading if it was significant on more than one factor and had loadings within .10 of each other on these factors.
For each of the Self-Perception, Self-Expression, and Decision Making Composite EFAs, items for the three subscales loaded together as expected by the established factor structure. All items loaded significantly onto their respective factors, with no cross-loadings. For the Interpersonal Composite EFA, four items either fell below the factor loading cutoff of ± .30 for their respective factor or cross-loaded with another factor. For the Stress Management Composite EFA, all items loaded significantly onto their respective factors with the exception of two items that were cross-loaded.
To summarise, the EFAs generated solutions that strongly correspond to the established EQ 360 2.0 factor structure, with the items for each subscale empirically grouping together onto the expected factors. Of the 126 items included in the EFAs, only six items were either cross-loading or fell below the cutoff of .30.
CORRELATIONS AMONG EQ 360 2.0 COMPOSITE SCALES AND SUBSCALES
Correlations among the EQ 360 2.0 composite scales and subscales were examined in the UK and Ireland normative sample to determine if the pattern of results found in the UK EQ-i 2.0 normative data could be replicated. Table C.37 (composite scales) and Table C.38 (subscales) display these correlations. Overall, these correlations were stronger in the EQ 360 2.0 data. Composite scale correlations ranged from r = .59 (Self-Expression/Interpersonal) to r = .83 (Decision Making/Stress Management). For the subscales, the correlations ranged from r = .25 (Emotional Expression/Independence) to r = .79 (Interpersonal Relationships/Empathy).