


Appendix H. EQ-i 2.0 Global Norms
This appendix presents the statistical results pertaining to the development of the EQ-i 2.0 Global Norms. Please see Global Norms for full interpretive text.
- Table H.1. Geographic Region Distribution of the EQ-i 2.0 Global Normative Sample
- Table H.2. Geographic Sub-Region Distribution of the EQ-i 2.0 Global Normative Sample
- Table H.3. Age × Gender Distribution of the EQ-i 2.0 Global Normative Sample
- Table H.4. Occupation Area Distribution of the EQ-i 2.0 Global Normative Sample
- Table H.5. Effect Sizes for Gender, Age, and World Region Effects in the EQ-i 2.0 Global Normative Sample
- Table H.6. Gender Differences in the EQ-i 2.0 Global Normative Sample
- Table H.7. Age Group Differences in the EQ-i 2.0 Global Normative Sample
- Table H.8. World Region Group Differences in the EQ-i 2.0 Global Normative Sample
- Table H.9. Effect Sizes for Pairwise World Region Group Differences in the EQ-i 2.0 Global Normative Sample
- Table H.10. Effect Sizes for Age, Gender, and World Region Interactions in the EQ-i 2.0 Global Normative Sample
- Figure H.1. Histogram of EQ-i 2.0 Total EI Standard Scores in the Global Normative Sample
- Table H.11. Internal Consistency of EQ-i 2.0 Scales in the Global Normative Sample
- Table H.12. Internal Consistency of EQ-i 2.0 Scales in the Global Normative Sample by World Region
- Table H.13. Correlations Among EQ-i 2.0 Composite Scales in the Global Normative Sample
- Table H.14. Correlations Among EQ-i 2.0 Subscales in the Global Normative Sample
Table H.1. Geographic Region Distribution of the EQ-i 2.0 Global Normative Sample
The following table presents the geographic distribution for the EQ-i 2.0 Global normative sample. Data were collected in 154 countries across 5 world regions. The percentage of countries represented within each region is shown.
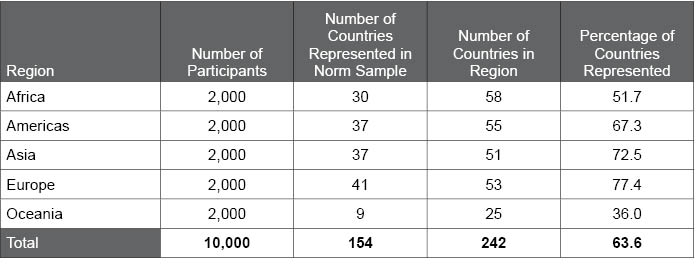
Table H.2. Geographic Sub-Region Distribution of the EQ-i 2.0 Global Normative Sample
The following tables present the geographic distribution within each world region for the EQ-i 2.0 Global normative sample.
Table H.2a. Geographic Distribution of the EQ-i 2.0 Global normative sample: Africa
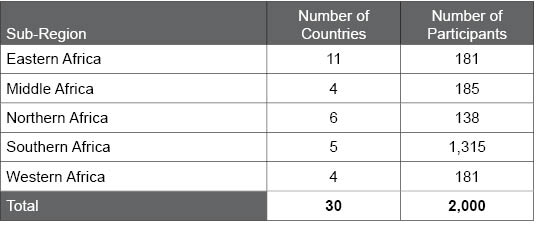
Table H.2b. Geographic Distribution of the EQ-i 2.0 Global normative sample: Americas
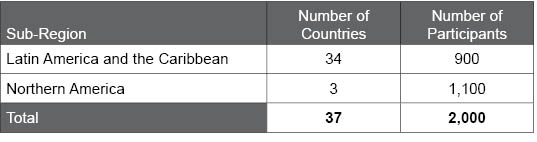
Table H.2c. Geographic Distribution of the EQ-i 2.0 Global normative sample: Asia
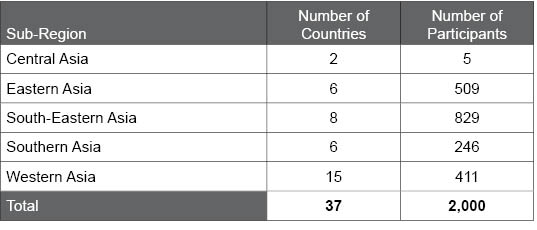
Table H.2d. Geographic Distribution of the EQ-i 2.0 Global normative sample: Europe
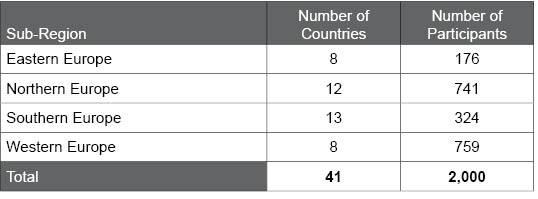
Table H.2e. Geographic Distribution of the EQ-i 2.0 Global normative sample: Oceania
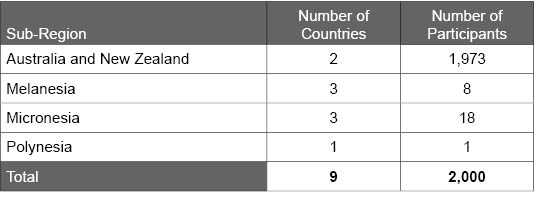
Table H.3. Age × Gender Distribution of the EQ-i 2.0 Global Normative Sample
The following table presents the distribution of the EQ-i 2.0 Global normative sample, categorized by age group and gender. An equal number of men and women were sampled at each age group.
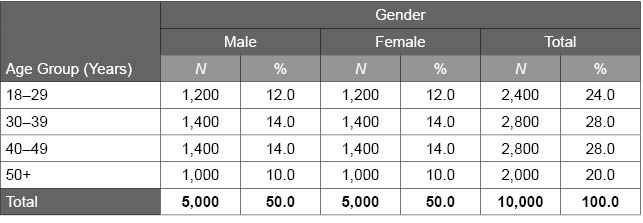
Table H.4. Occupation Area Distribution of the EQ-i 2.0 Global Normative Sample
The following table summarizes the occupation area distribution of the EQ-i 2.0 Global normative sample.
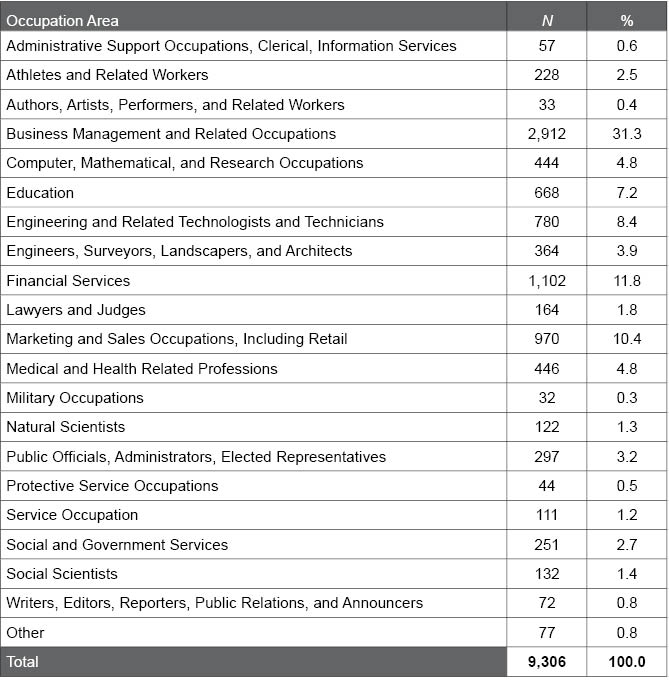
Table H.5. Effect Sizes for Gender, Age, and World Region Effects in the EQ-i 2.0 Global Normative Sample
The following table summarizes the effect sizes for the effects of gender, age, and world region on the EQ-i 2.0 Total EI score, composite scales, and subscales in the Global normative sample. Meaningful effect sizes (i.e., |d| ≥ 0.20, partial η2 ≥ .01) suggest differences among participants based on the demographic variable.
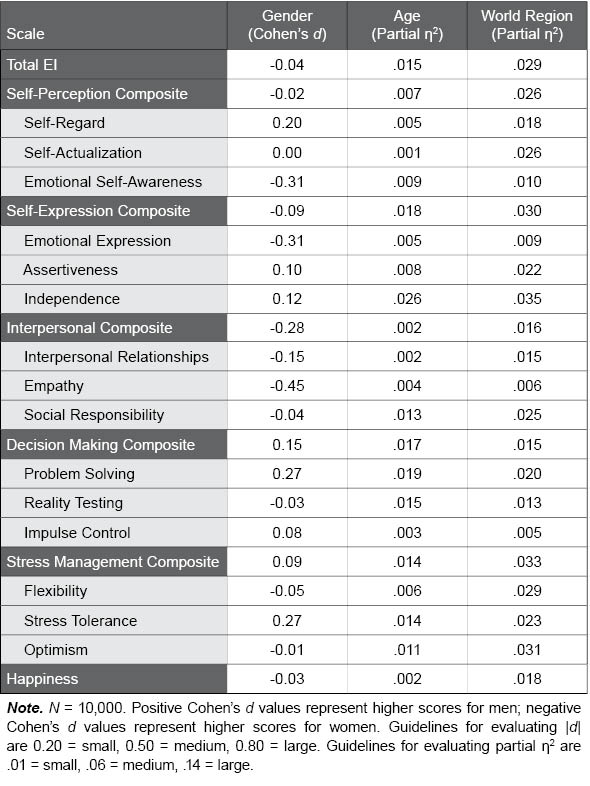
Table H.6. Gender Differences in the EQ-i 2.0 Global Normative Sample
The following table provides EQ-i 2.0 standard score scale means and standard deviations for males and females in the Global normative sample. F and p values convey the statistical significance of gender differences; p values lower than .01, which were found for most scales, indicate significant differences between males and females.
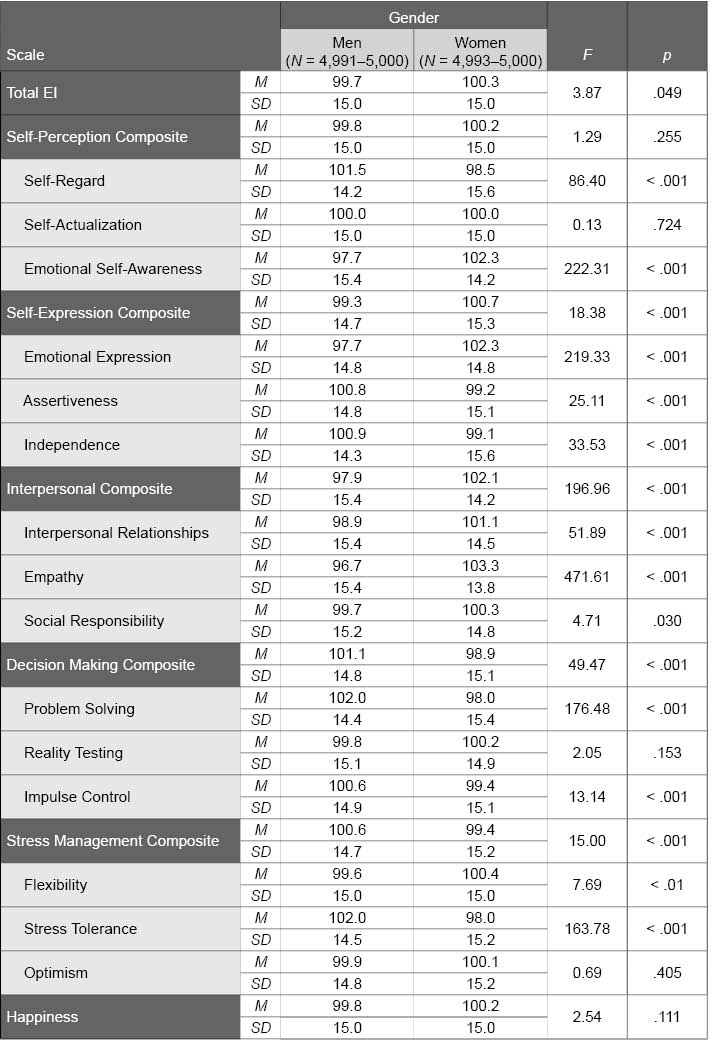
Table H.7. Age Group Differences in the EQ-i 2.0 Global Normative Sample
The following table provides EQ-i 2.0 standard score scale means and standard deviations for the various age groups in the Global normative sample. F and p values convey the statistical significance of age group differences; p values lower than .01, which were found for all scales, suggest significant differences among the age groups.
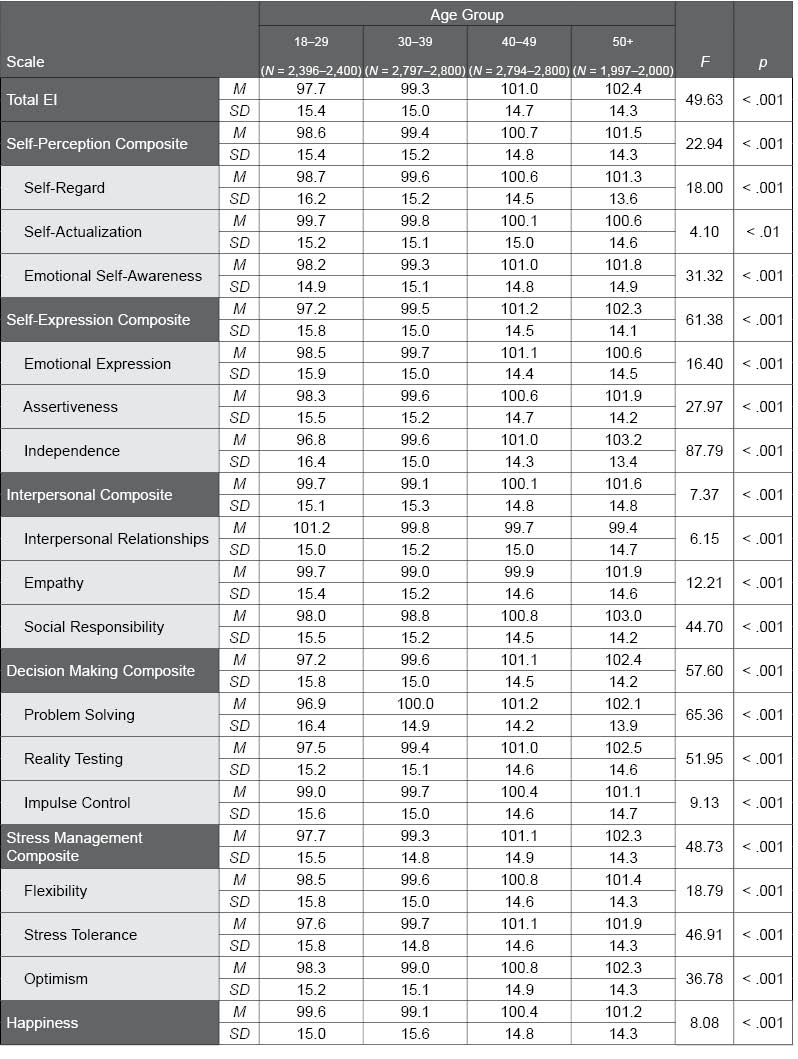
Table H.8. World Region Group Differences in the EQ-i 2.0 Global Normative Sample
The following table provides EQ-i 2.0 standard score scale means and standard deviations for the various world regions in the Global normative sample. F and p values convey the statistical significance of group differences; p values lower than .01, which were found for all scales, suggest significant differences among the world regions.
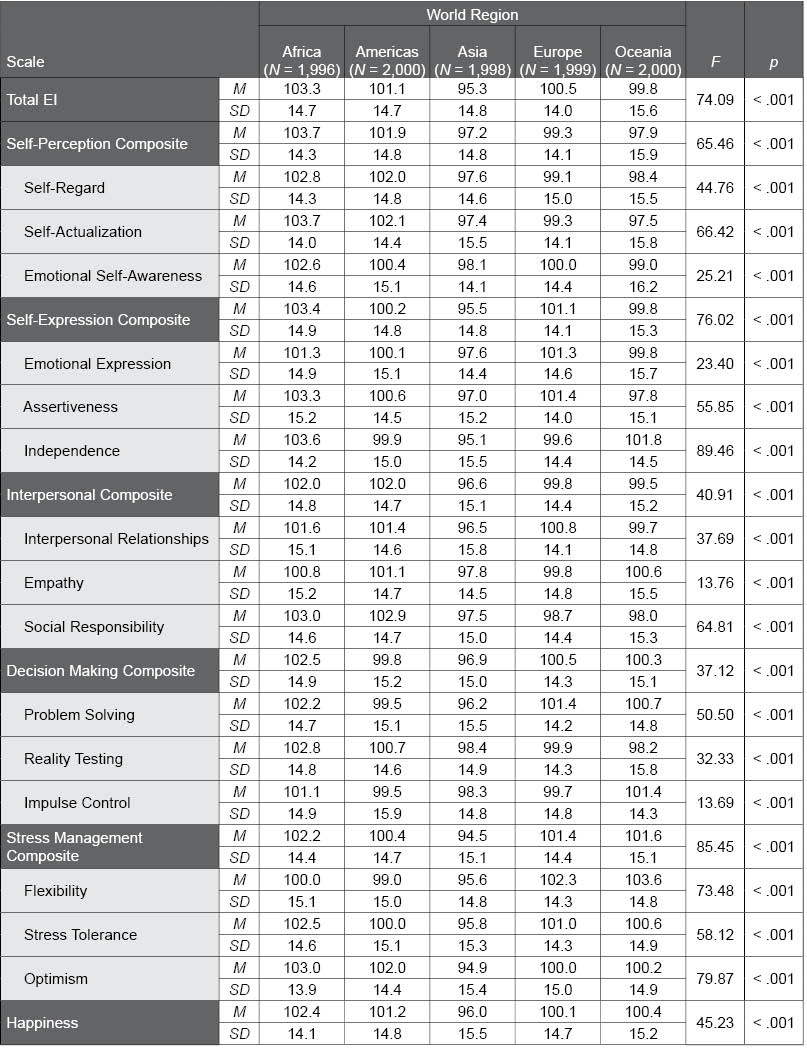
Table H.9. Effect Sizes for Pairwise World Region Group Differences in the EQ-i 2.0 Global Normative Sample
The following tables summarize the effect sizes (Cohen’s d) for pairwise comparisons between regions. Each table presents the effect sizes between one region and each of the other four regions. Several meaningful differences between the regions were found.
Table H.9a. Effect Sizes for Regional Comparisons: Asia
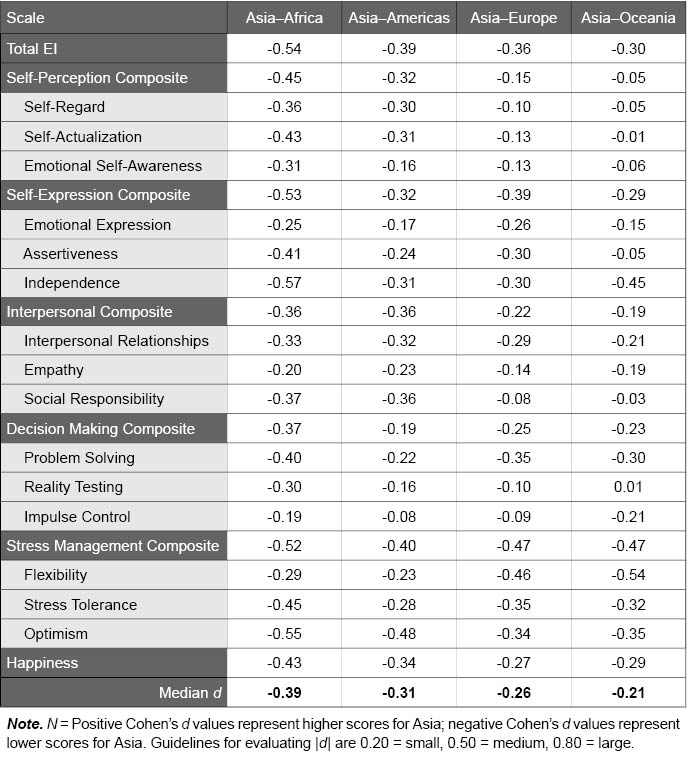
Table H.9b. Effect Sizes for Regional Comparisons: Africa
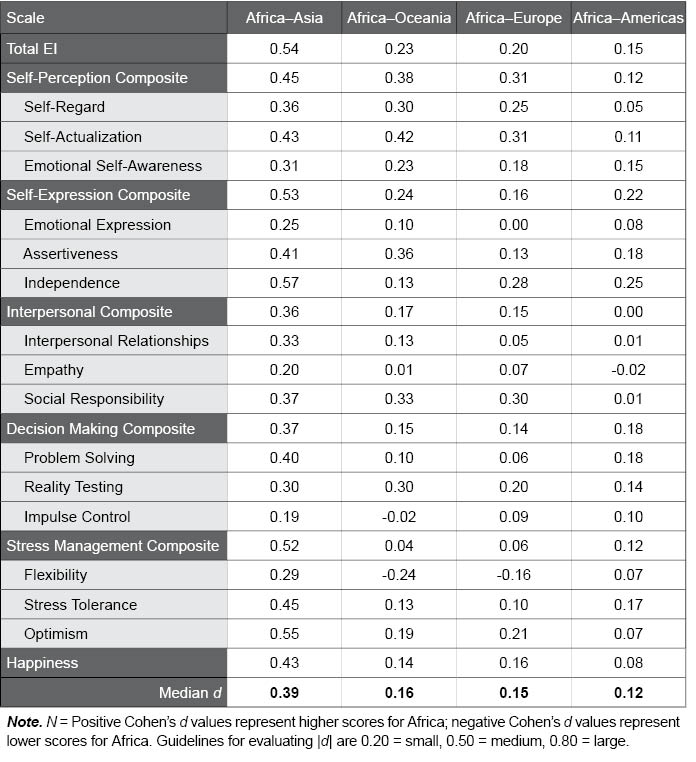
Table H.9c. Effect Sizes for Regional Comparisons: Americas
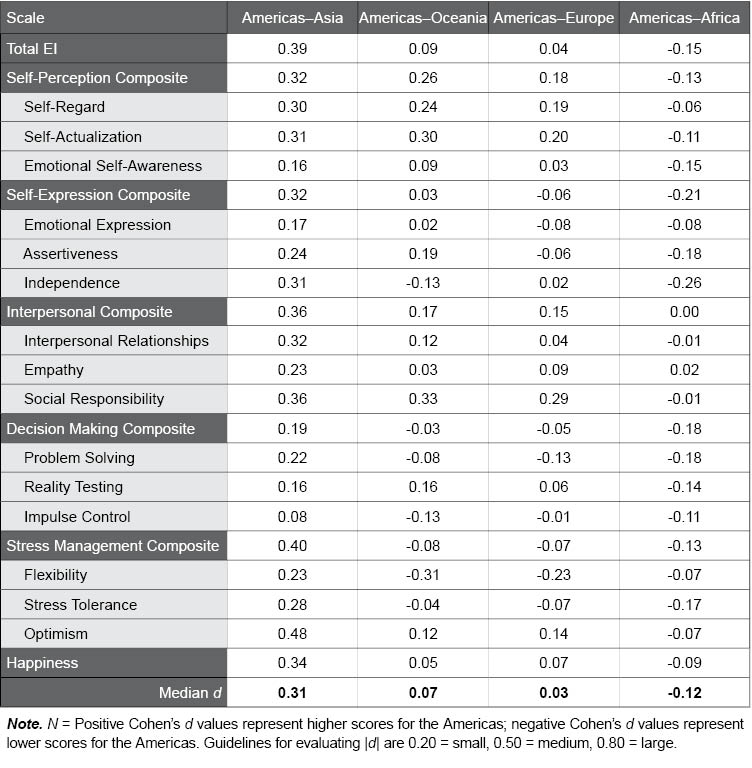
Table H.9d. Effect Sizes for Regional Comparisons: Europe
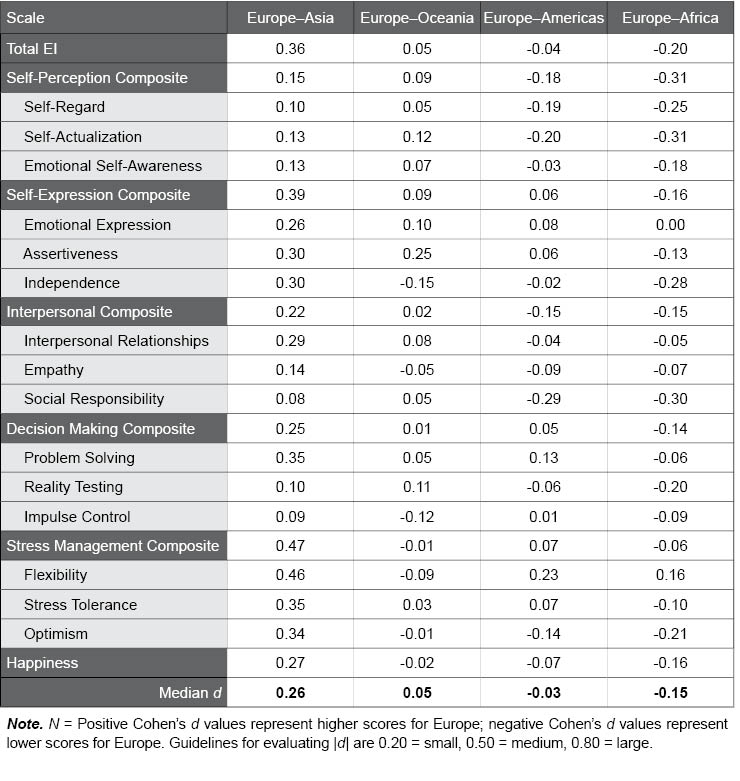
Table H.9e. Effect Sizes for Regional Comparisons: Oceania
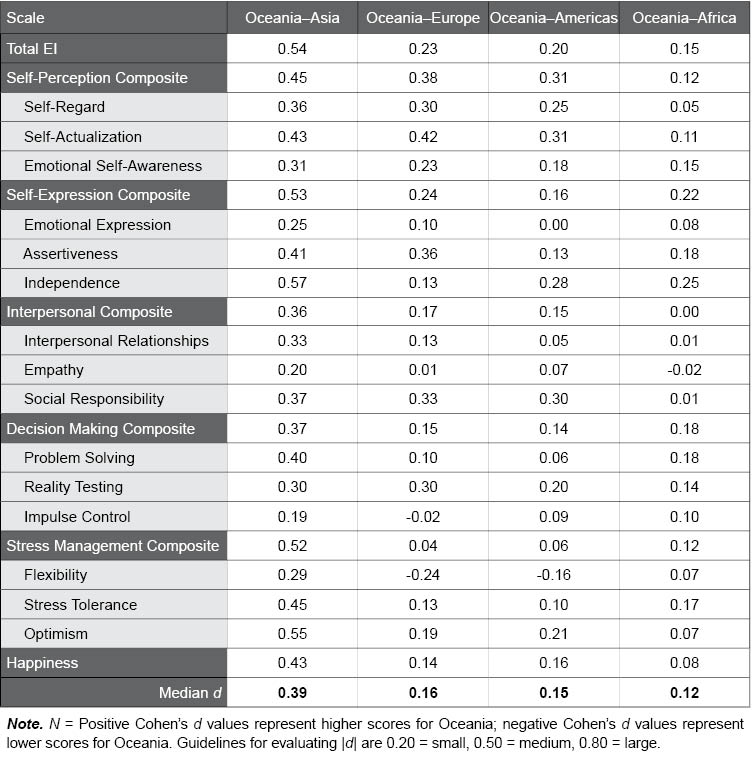
Table H.10. Effect Sizes for Age, Gender, and World Region Interactions in the EQ-i 2.0 Global Normative Sample
The following table summarizes the effect sizes for the interactions between gender, age, and world region on the EQ-i 2.0 Total EI score, composite scales, and subscales in the Global normative sample. Meaningful effect sizes (partial η2 ≥ .01) would suggest significant interactions among the demographic variables, though none of the effects presented here reach the minimum criteria.
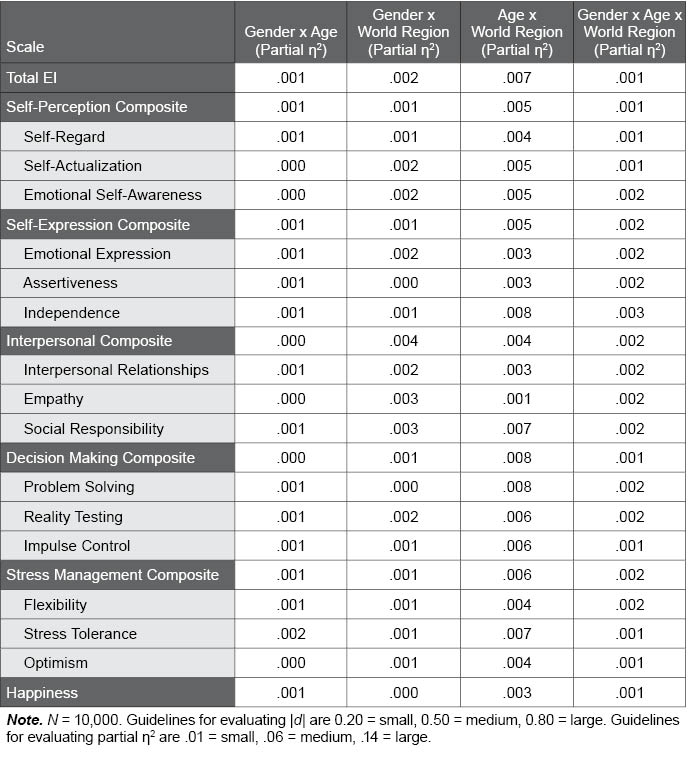
Figure H.1. Histogram of EQ-i 2.0 Total EI Standard Scores in the Global Normative Sample
This figure illustrates the distribution of EQ-i 2.0 Total EI standard scores in the Global normative sample. The distribution of the actual scores closely approximates the normal “bell-shaped” curve (shown using the black curved line), which suggests that it is unnecessary to apply a normalizing transformation to the scores. Distributions for most other composite scales and subscales show a similar pattern, some with a slight negative skew.
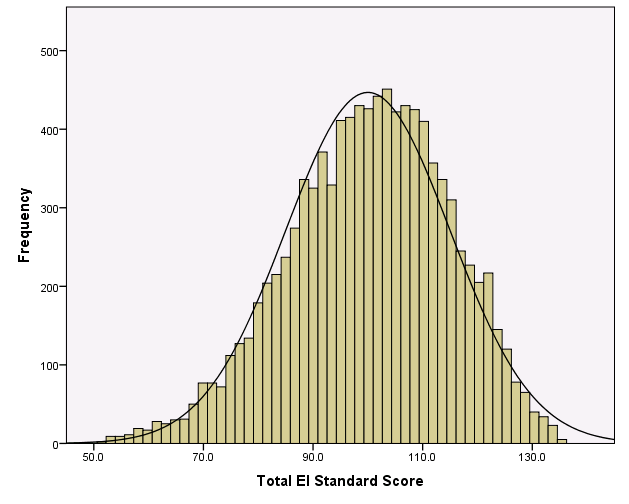
Table H.11. Internal Consistency of EQ-i 2.0 Scales in the Global Normative Sample
The following table summarizes the internal consistency (Cronbach’s alpha) values for the EQ-i 2.0 scales in the Global normative sample, presented overall and separately by Gender and Age norm group. Alpha values range from 0.00 to 1.00. Higher values, like those found in the Global normative sample, provide evidence for strong reliability.
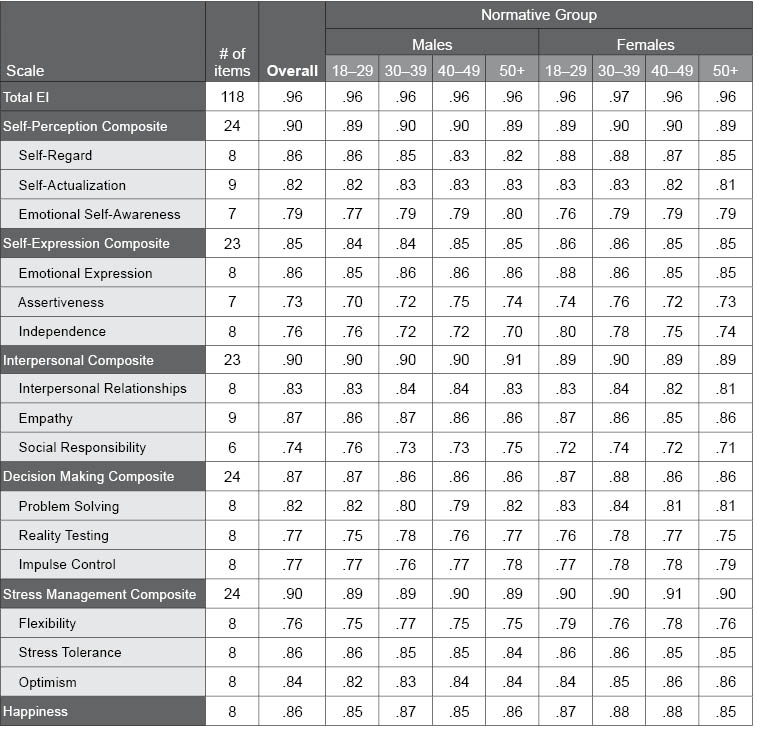
Table H.12. Internal Consistency of EQ-i 2.0 Scales in the Global Normative Sample by World Region
The following table summarizes the internal consistency (Cronbach’s alpha) values for the EQ-i 2.0 scales in the Global normative sample, presented separately by world region. Alpha values range from 0.00 to 1.00. Higher values, like those found in the Global normative sample, provide evidence for strong reliability.
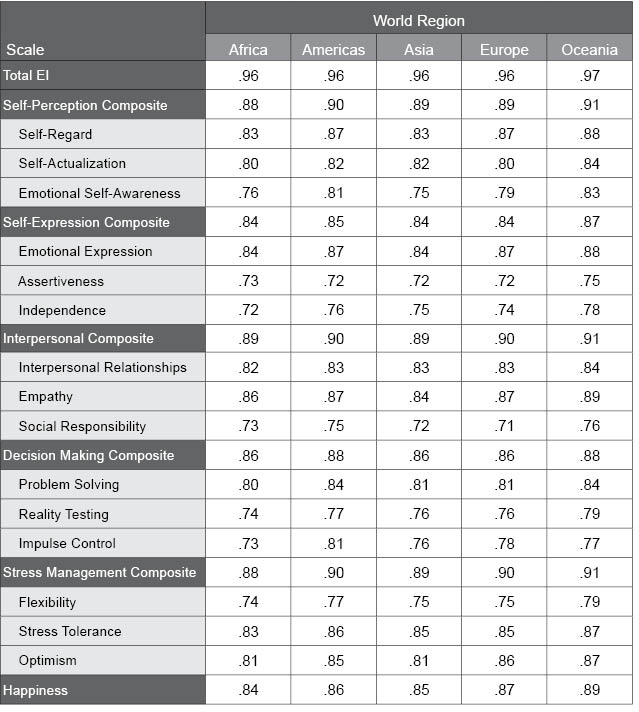
Table H.13. Correlations Among EQ-i 2.0 Composite Scales in the Global Normative Sample
The following table illustrates the correlations among the EQ-i 2.0 composite scales in the Global normative sample. The correlations seen here range from .44 to .70, with higher values suggesting the scales are interrelated and measure a common construct (i.e., emotional intelligence). Very high values (e.g., > .90) would suggest a unidimensional factor structure. Moderate to large correlations, like those found in the Global normative sample, support both the concept that the scales measure an underlying common construct, as well as the multidimensional factor structure of the EQ-i 2.0.
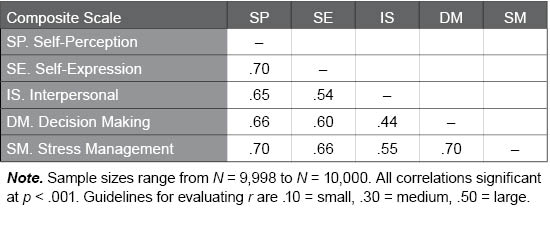
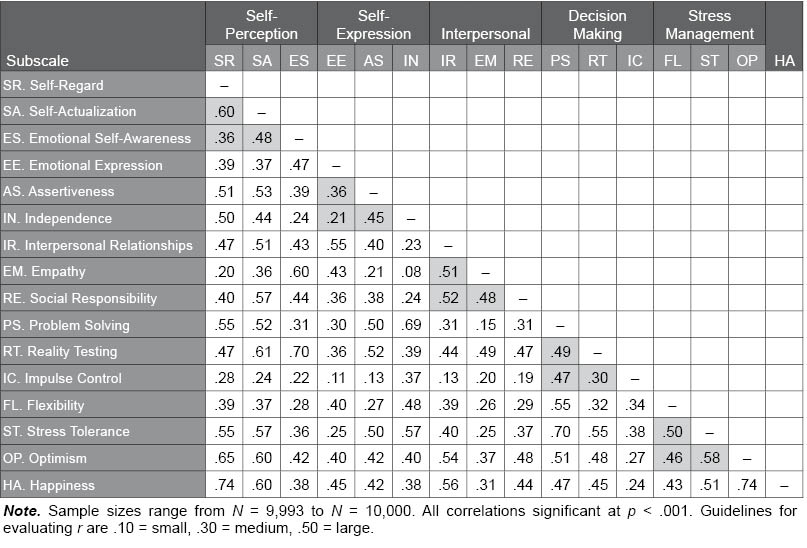
Table H.14. Correlations Among EQ-i 2.0 Subscales in the Global Normative Sample
The following table illustrates the correlations among the EQ-i 2.0 subscales in the Global normative sample. The correlations seen here range from .08 to .74, with higher values suggesting the scales share a relevant common psychological characteristic. Shaded cells indicate correlations between subscales within the same composite scale. Moderate to large correlations were found within the composite scales, supporting both the concept that the scales measure a common psychological characteristic, as well as the multidimensional factor structure of the EQ-i 2.0.