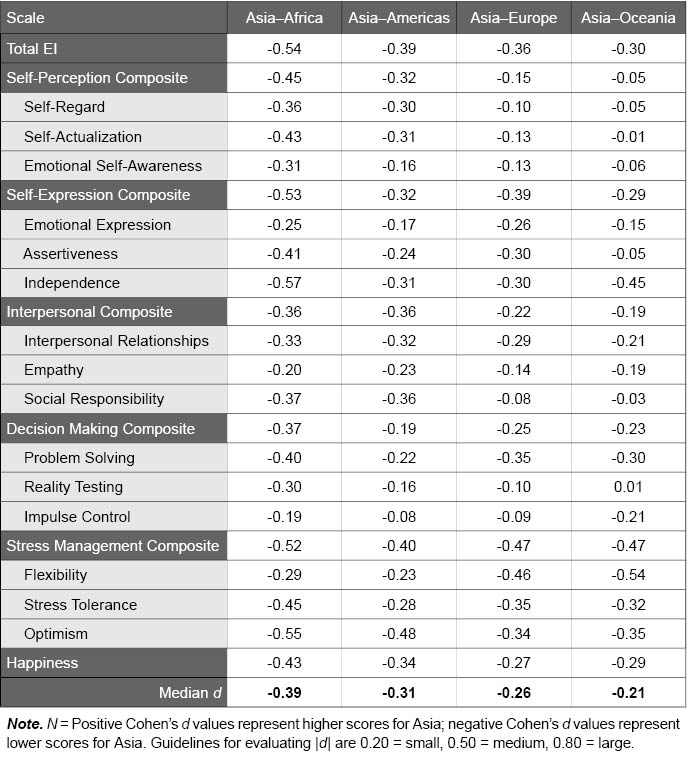
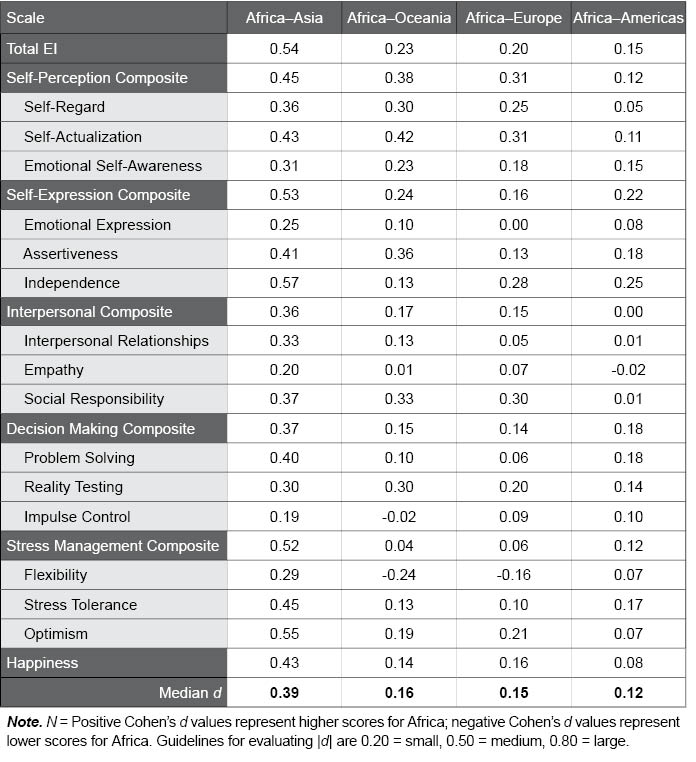
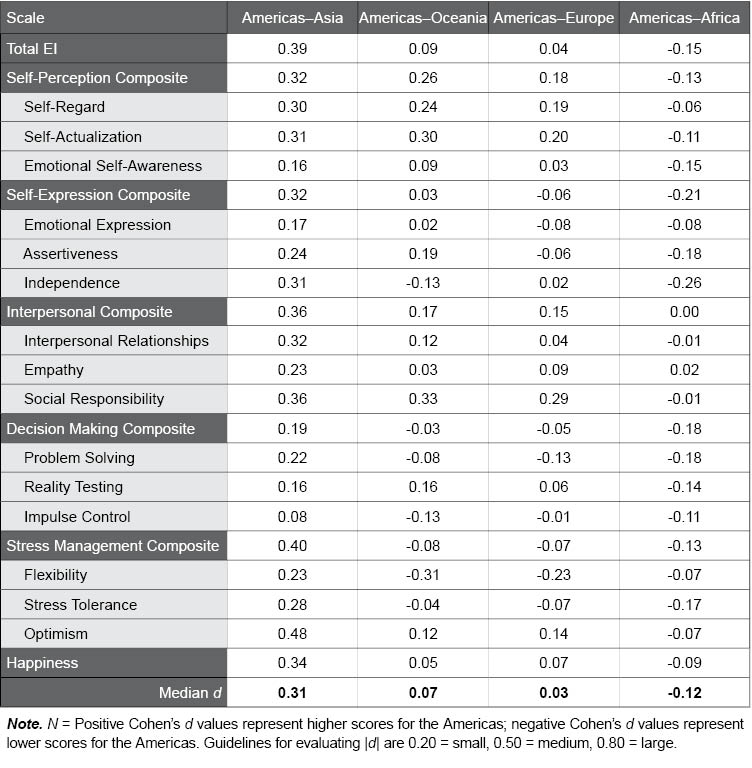
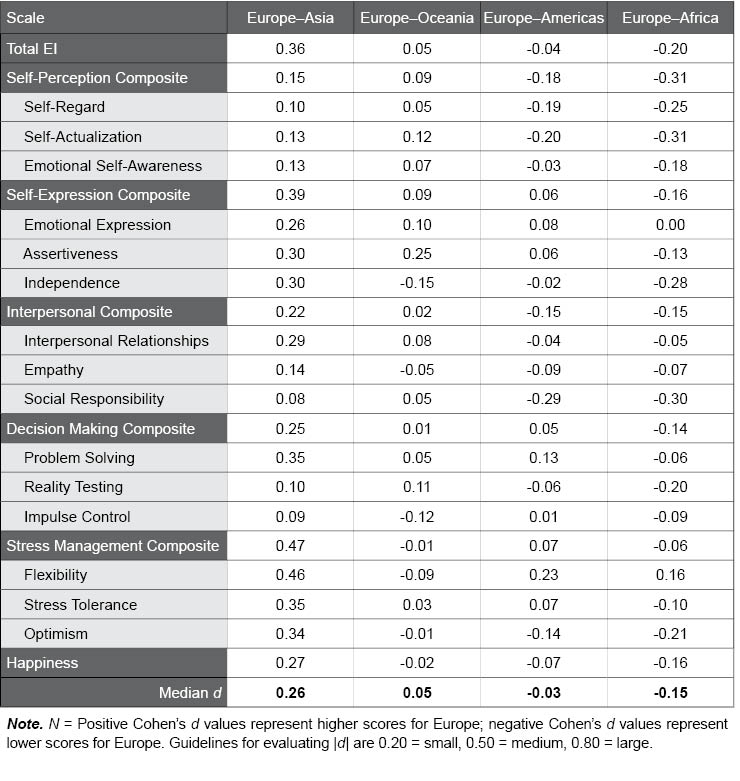
Appendix H. EQ-i 2.0 Global Norms
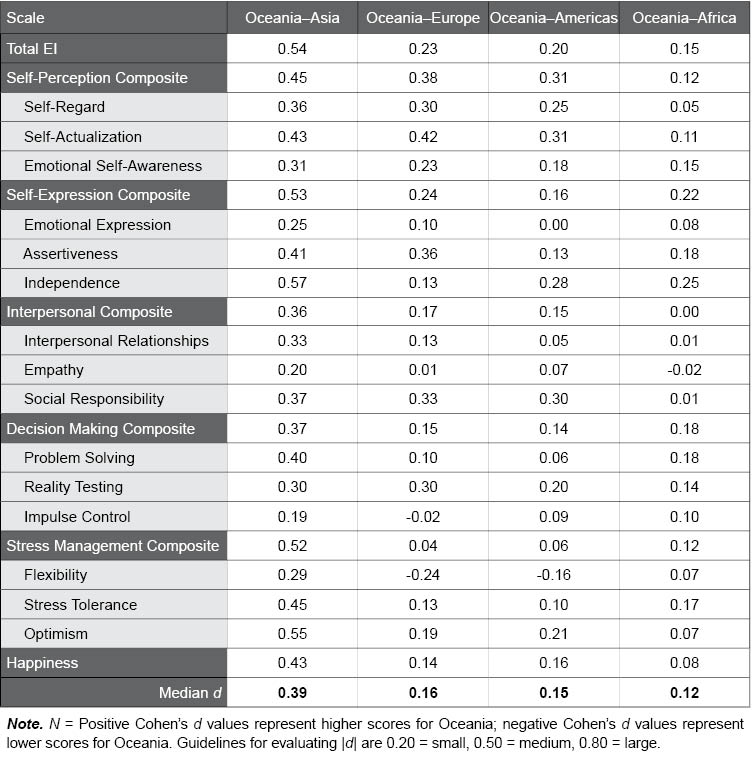
Table H.9. Effect Sizes for Pairwise World Region Group Differences in the EQ-i 2.0 Global Normative Sample
The following tables summarize the effect sizes (Cohen’s d) for pairwise comparisons between regions. Each table presents the effect sizes between one region and each of the other four regions. Several meaningful differences between the regions were found.