
EQ-i 2.0 Group Report Supplement
The EQ-i® 2.0 Group Report combines the EQ-i 2.0 scores of individuals in a manner that allows you to make interpretations at the group or team level. This report presents an overview of group results that identifies group strengths as well as the areas where the group as a whole can be more effective. Furthermore, the EQ-i 2.0 Group Report discusses the organizational implications of a group’s emotional intelligence (EI) score and recommends strategies for action that can further develop the group’s potential.
Many additions and improvements have been included in the EQ-i 2.0 Group Report to increase the report’s functionality and ease of interpretation.
- Coach and Client Versions of the Group Report: Users of the original EQ-i Group Report indicated that they would also like a report designed especially for the client. We considered this feedback when designing the EQ-i 2.0 Group Report and you are now able to generate Coach and Client Reports.
- Coach Report: Contains all summary pages and presents detailed descriptive information for each subscale.
- Client Report: Also includes the overall summary pages (Executive Summary, the Overview of Group Results, and the Strategies for Action pages) as well as the EQ-i 2.0 Model.
- Group Response Style Explained Page: An entire page is now devoted to explanations of the validity indicators in the EQ-i 2.0 Group Report.
- Group Pattern Analysis Page: This page displays the relationship between individual scores and group averages in a visually appealing and easy to interpret graph.
- Information Regarding Organizational Implications and Strategies for Action: We heard through customer feedback that our coaches would like greater support around the interpretation of scores. As a result, we revised the implications sections to demonstrate how a group’s level of EI may affect the group and the organization. Additionally, in the new EQ-i 2.0 Group Report, strategies for action are provided for all subscales.
- Report Structure: The group results and implications sections in the EQ-i 2.0 Group Report are organized to reflect a greater focus on the EQ-i 2.0 model and subscales. In the EQ-i 2.0 Group Report, information for each subscale is compiled onto a single page so that with one glance you are able to see detailed information regarding the group’s subscale score and response tendencies, as well as the implications and developmental strategies associated with the group’s subscale score.
- More Comprehensive Summaries: Not only does the EQ-i 2.0 Group Report convey detailed information for each subscale, it also presents comprehensive summaries of overall results through the Executive Summary, Overview of Group Results, Group Pattern Analysis, and Strategies for Action pages.
To assist you with your understanding and interpretation of the EQ-i 2.0 Group Report, this supplement is organized to present the following information:
- Section One: A brief overview of the benefits of providing group feedback to individuals or groups of people.
- Section Two: Some tips and guidelines detailing effective methods of providing group feedback.
- Section Three: A discussion of the benefits that the coach and client reports may bring to your administration of group feedback sessions.
- Section Four: A description of the features of the Group Report and information regarding how to use the report and interpret group results.
Consistent with the EQ-i 2.0 Report suite, the EQ-i 2.0 Group Report is flexible to the individual needs of you and your clients. As such, some of the features described in section four of this supplement are options, meaning you can turn them on or off depending on your interpretation needs.
Please note that because the EQ-i 2.0 Group Report only presents aggregated results, the assessment scores of individuals remain private. Consequently, we strongly recommend that coaches provide individualized feedback to clients regarding their EQ-i 2.0 Workplace or Leadership reports prior to conducting a group feedback session. This will give clients a greater understanding of how to interpret their individual-level EI scores in relation to a broader group context.
| For information on how to interpret individual EQ-i 2.0 Workplace reports, please refer to Part IV: Understanding the Results in the EQ-i 2.0 manual. |
In today’s workplace, people often pool their knowledge and skills by working in groups so that they may complete complex tasks. In these cases, feedback given to a group in an appropriate time and manner may shape the group’s learning process, which will in turn influence the group’s performance and the processes that they use to coordinate and complete their tasks (Kozlowskil & Ilgen, 2006; London & Sessa, 2006). Managers or consultants give group feedback for a variety of purposes, such as the ones listed below (Gabelica, Van den Bossche, Segers, & Gijselaers, 2012; London & Sessa, 2006):
- To guide, motivate, and reinforce effective behaviors.
- To reduce or stop ineffective behaviors.
- To bring into focus the resulting outcomes of an activity, process, or assessment.
- To provide information and guidance when the group starts drifting away from initially set goals.
- To assist groups in adjusting or fixing new goals.
- To promote critical reflection on specific tasks or situations so that new insights and approaches may be acquired.
- To assist a group in developing a shared mental model so that group members possess similar expectations and awareness of group behaviors, abilities, knowledge, and skill levels.
Researchers found that the delivery of group feedback had a positive effect on group outcomes such as:
- Group goal commitment (Hoegl & Parboteeah, 2006),
- Group efficacy, which describes a group’s belief regarding its ability to perform effectively (Jung & Sosik, 2003) and
- Group cohesion (Philo, 2004).
When managers or consultants give group-level feedback as a complement to individual-level feedback, group members are able to gain an understanding of how their group behaves as an entity along with obtaining an idea of how they, as individuals, contribute to their group (Gabelica et al., 2012). In terms of the EQ-i 2.0, this means that after clients have completed their individual feedback sessions regarding their Workplace or Leadership reports, coaches may use the EQ-i 2.0 Group Report to switch group members’ focus from themselves to their team or group. By discussing the organizational implications and developmental strategies outlined in the coach version of the Group Report, clients will gain a greater understanding of how their individual EI tendencies influence the functioning of their group and organization.
Furthermore, feedback given at both the individual and group-levels is more effective at influencing group performance than feedback given at only the individual-level or the group-level (Matsui, Kakuyama, & Onglatco, 1987). Researchers reason that feedback effectiveness can be maximized if it is provided at both the individual and group-levels because if individual-level information is not provided, then group members who are below average on individual assessments will not be motivated to improve their performance if their group is successfully meeting group goals. Conversely, if no feedback is given at the group-level, then individuals who are in low-performing groups but who are meeting their individual targets will also not see a need to enhance their performance (Matsui et al., 1987).
This two-pronged approach to providing feedback appears to be most effective when used with people who identify strongly with their group (Rabinovich & Morton, 2012). Highly-identified group members are motivated to maintain consistency between individual- and group-level assessments; consequently, if an inconsistency is brought to their attention, these group members will be highly motivated to change either their own behaviors or attitudes, or they will attempt to influence the attitudes or behaviors of their group (Rabinovich & Morton, 2012). For example, if an individual who identifies strongly with the group finds out that he or she scored much lower on a specific EI subscale than the group did on average, he or she will be more motivated to engage in the changes needed to resolve and overcome this inconsistency.
| What is the ideal group size to use for conducting group feedback sessions? Optimal group size is dependent on many factors such as the purpose of the group session and the preferences of the group facilitator. We recommend that group feedback sessions be conducted with groups of four to twelve members (Kitzinger, 1995; Tang & Davis, 1995). When providing group feedback, the best results are obtained when the group is not too small or too large. Using appropriate group sizes can increase group members’ willingness to express their thoughts and simplify the process of reaching group consensus about developmental strategies. |
Providing group feedback involves the communication of group information (e.g., regarding the group’s actions, performance, processes, or behaviors) to the group as a whole or to individual group members (Gabelica et al., 2012). Researchers found that feedback delivered in private or in a group environment both had positive effects (DeWett, 2003). For example, Nadler (1979) found that giving group-level feedback in a group setting led to increased feelings of group involvement and emotional attraction to the group and giving individual-level feedback in a group setting led to improved individual performance. Studies like this demonstrate that coaches may use group settings to influence individual group members’ commitment to behavior changes.
In other words, even though individual group members will already know through their one-on-one sessions with the coach the areas or behaviors on which they need further development, the coach may increase the commitment of individuals to follow through with their developmental strategies by discussing in a group setting how specific behaviors or skills could be improved. For instance, imagine a scenario where some of the group members obtained a lower score for Assertiveness and you had already discussed with them during their individual feedback sessions the strategies they may use to increase their Assertiveness score. During the group feedback session, you may want to provide these group members with additional motivation to engage in change behaviors and consequently, you may ask the group to describe situations in the past where they themselves successfully displayed assertive behaviors or situations where they observed other group members displaying assertiveness appropriately. You can then follow up these examples with a discussion about how increased assertiveness could benefit the group.
On a cautionary note, when asking for examples of behaviors exhibited by group members in the past, we would advise coaches to ask for examples of only positive behaviors. Mention of negative individual-level behaviors in group settings may increase group members’ tendency to try to identify and blame other group members, which can lead to targeted individuals feeling greater resistance or reluctance to engage in developmental behaviors. The negative emotions experienced when a person is publicly blamed may also increase the likelihood that he or she will disengage from the team (i.e., from the source of the constructive feedback; Philo, 2004).
Best practices for delivering feedback usually follow these conditions (Alvero, Bucklin, & Austin, 2001; Gabelica et al., 2012). Specifically, it is best if the feedback:
- Is provided in a timely and nonthreatening manner.
- Is specific, verbal, and accompanied by visual representations such as graphs.
- Is provided in combination with other procedures such as employee training or linked to behavioral consequences.
- Is given by managers and third-party experts such as EQ-i certified individuals rather than by managers alone.
- Is shared among group members or distributed in an equal manner.
- Allows group members to compare their individual performance to a standard, such as team performance or previous performance experiences. People’s reactions to feedback are often influenced by the performance status of the group to which they belong.
So far, we have been discussing methods for providing feedback in general. However, you may be wondering whether these recommendations also apply to the delivery of constructive feedback. For example, how should a group feedback session proceed if you are dealing with a group who has overall low EI? While many researchers agree that imparting positive group feedback can lead to many beneficial group outcomes (such as increases in group performance, proficiency, and more positive attitudes towards tasks), research findings regarding the influence of constructive feedback given in group settings are more conflicted (Gabelica et al., 2012).
When constructive feedback is presented to a group, the group may respond by demonstrating a variety of reactions such as blaming (internal to the team or to an external source/situation), excuse making, or if they accept the constructive feedback, they may strategize methods of improvement (Philo, 2004). Group members that share experiences of past successes or possess high levels of intragroup trust are more successful at accepting and processing constructive group feedback, especially if they perceive the presentation of constructive group feedback as potentially benefiting the group in some way (London & Sessa, 2006; Peterson & Behfar, 2003). On the other hand, Peterson and Behfar (2003) report that newly formed groups may view constructive group feedback as a “threat,” with the delivery of constructive feedback being linked to increased occurrences of conflict within a group. These and other similar research findings suggest that when a group or team is newly formed or possesses low levels of intragroup trust, then the provision of constructive group feedback can be more detrimental than motivating and can lead to increased levels of intragroup conflict in the future (Peterson & Behfar, 2003).
Consequently, prior to deciding what type of feedback is needed for a group and how it should be delivered, you may find it helpful to first determine the learning goals and developmental status of a group (e.g., established group versus newly-formed group, group with shared successes versus failures, group with high versus low levels of intragroup trust; London & Sessa, 2006). If your assessment of the group’s developmental status leads you to believe that they may be receptive to constructive group feedback, you may experience greater success at gaining the group’s engagement by utilizing some or all of the following recommendations (Parker & Baughan, 2011), as you deem appropriate:
- Be specific about the ways in which this feedback may benefit the group’s future by improving the group’s future performance and relationships.
- Discuss both the strengths and challenges of the group for the subscales in question (as opposed to only focusing on the constructive aspects).
- Constructive feedback is more likely to positively affect group performance if you are able to get group members to accept responsibility for previously performing below ideal standards without lowering or threatening the group’s self-concept or self-esteem (Philo, 2004). Consequently, it is advisable to begin by discussing the group’s strengths in high-scoring subscales (and raise their self-esteem) before bringing the focus towards their potential challenges (i.e., lower-scoring subscales).
- Provide a standard or goal of the types of EI behaviors they should be striving for within a low-scoring subscale; identify or discuss the gap between this standard and their current EI performance for that subscale. Lastly, provide specific guidance for how to make improvements so that they may close the gap between the goal and their current performance (Fishbach & Finkelstein, 2012).
Additionally, in the interests of preventing the potential blaming ofindividual group members, a possible deterioration of group harmony, and a decrease in feelings of intragroup cohesion, it is advisable for you to keep anonymous from the group any information that may identify specific individuals as low scorers on EI subscales. Instead, it is best to discuss with individuals in the privacy of one-on-one sessions the areas of emotional intelligence where further development is recommended.
Coach Report:
You can use the Coach Report to guide your interactions with the group. For example, before diving right into the group’s subscale results, take a moment to assess the information provided on the Group Response Style Explained page regarding validity indicators. This page will identify the group’s response tendencies. If this page raises any validity concerns, you may have to vary the approach you use to give group feedback.
- Inconsistency Index: If multiple group members are inconsistent in their responses, then this may imply that they rushed through the assessment or randomly responded to items, are indecisive or unsure of themselves, or are being overly influenced by the wording nuances of the assessment items. Check to see if flags are raised in the “average time to completion” section of the Group Response Style Explained page and then engage in further discussion with the group to discuss their experience of completing the EQ-i 2.0 assessment.
- Positive Impression and Negative Impression: When multiple members of the group use an overly positive or overly negative response style when completing the EQ-i 2.0, this may influence the approach that you use when introducing developmental strategies to the group. If a high percentage of group members use an overly positive response style, they may for example, be unwilling to face their limitations, may be attempting to avoid criticism, or may lack personal insight. References to the group’s potential weaknesses may be met with resistance, denial, or hostility. Conversely, if multiple members of the group have an overly negative response style, then these group members may focus only on the group’s lower-scoring areas and you might need to make a greater effort to raise the group’s self-esteem so that they are more motivated to engage in developmental behaviors.
- Item 133 (My responses to the preceding sentences were open and honest): If a high percentage of group members choose a response of “3” or lower, indicating that they may not have provided honest responses to the assessment items, then a group discussion should be held to explore the reasons why group members feel they are unable to respond honestly.
- Omitted Items: If a high percentage of group members omitted 9 or more items on their EQ-i 2.0 assessment, you might find it helpful to examine the % Distribution of Responses table on each subscale page to see whether you can identify a pattern in the items that are being omitted. For example, while scanning through the % Distribution tables, you might find that there are items that all group members chose to omit. In that case, you can engage in further discussion with the group to determine whether the omission is due to the item(s) not being relevant to their work context or if there is some other underlying cause for the omitted responses (e.g., organization culture).
Client Report:
Having the option to hand out Client Reports during a group feedback session may benefit you and the group in many ways. For example, generating client reports:
- Saves Time! You will no longer have to spend time and effort figuring out what information is appropriate for sharing with the group because we will already have done that for you. Instead of cutting and pasting graphs or tables into a separate document for handouts, the Client Report presents group results in an organized and visually appealing manner.
- Increases Group Engagement. Providing group members with Client Reports can increase the amount of engagement or interaction that they have with the results. Because the Client Report is composed of the overall summary pages of the Group Report, group members can compare their individual Workplace or Leadership results to the group’s scores at later points in time.
- Assists with Interpretation. There may be times when group members are able to provide alternative explanations for results because they are privy to insider information or are able to see trends that are not readily apparent to people outside of the group. These types of revelations are more likely to come about if clients also have access to group results and are encouraged to voice their thoughts regarding the issues discussed during group feedback sessions.
| Due to concerns about maintaining participant anonymity, the Group Report will not include averages for subscales with less than two valid participant scores; instead, the Group Report will omit these subscales from relevant sections. |
The purchase of a Group Report will allow you to generate Coach Reports and Client Reports. To protect the privacy of group members, scores that may potentially identify individuals are included in the Coach Report while the Client Report is composed of general summary pages. Table 1 below lists the features that are present in the Coach and/or Client Reports.
Table 1. Composition of the Coach Report and Client Report
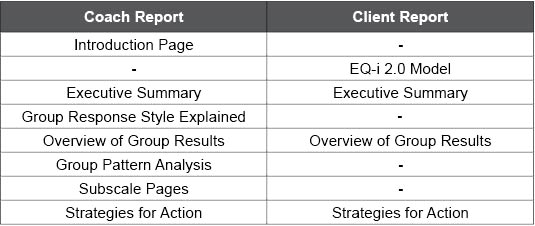
Like the other products in the EQ-i 2.0 Report suite, we designed the EQ-i 2.0 Group Report with ease of interpretation in mind. The following section provides brief descriptions of the report features listed in Table 1.
Group Report Features
- Introduction Page
The Introduction page of the Coach Report provides a brief overview of the different sections of the report.
- EQ-i 2.0 Model Page
Because group members may be less familiar with the EQ-i 2.0 Framework, we have included the EQ-i 2.0 Model in the Client Report.
- Executive Summary
The purpose of the Executive Summary is to provide a quick snapshot of a group’s level of EI by displaying the group’s three highest- and three lowest-scoring subscales in a single page. The average scores for these highest and lowest subscales are displayed in bar charts along with brief descriptions of the relevant subscales. Depending on the length of time that you have available for a group feedback session, you may or may not have enough time to include a discussion of all 15 subscales. If you are more restricted on time, the Executive Summary page is a good place to start because it quickly identifies a group’s three highest- and three lowest-scoring subscales, allowing you to focus the session by selecting specific skills/behaviors for praise or further development.
- Group Response Style Explained
Similar to the “Response Style Explained” page of the EQ-i 2.0 Workplace and Leadership Reports, this page includes information regarding group validity indicators (i.e., inconsistency index, positive and negative impression indices, Item 133 responses, and omitted items). Please refer to Step One: Assess the Validity of the Results for more information regarding how to interpret validity indicators. Additionally, if any members of the group completed the assessment in an unusually short amount of time, the report will flag this information under the Participant Summary section of this page.
- Overview of Group Results
While the Executive Summary shows the group averages for the three highest- and three lowest-scoring subscales, the Overview of Group Results page shows the group’s average scores for all EQ-i 2.0 composite scales and subscales, along with the average Total EI score.
- Group Pattern Analysis
The Group Pattern Analysis page displays the relationship between individual scores and group averages. Because the individual scores for all group members are displayed on the same graph, you will be able to see how close together or how far apart group members’ scores are for each particular EQ-i 2.0 scale. These graphs will assist you with identifying EI patterns in your group. In particular, look for scales where there are clumps of similar scores or outliers, as the presence of outliers may skew interpretations of the results. Similar to the bar charts on the Executive Summary page, the graphs on the Group Pattern Analysis page will be omitted for scales that have fewer than two valid participant scores.
- Subscale Page
Each Subscale Page presents the group results for an EQ-i 2.0 subscale. A bar graph that shows the distribution of scores for the group is shown at the top of the subscale pages so you can see trends that might not be as noticeable when just using averages. For example, you can have a group average that is just below 100 and might not think it is important. However, when you look at the bar graph it may reveal that there is a sub group of members who have notably low scores. In some cases, even though the group average is not affected that much, it may indicate the need for development for a subset of individuals within the group. To the right of the bar graph, you will see the Group Snapshot table, which displays additional descriptive information regarding the group’s results for a particular subscale such as the group’s subscale score (average), the minimum score, the maximum score, and the spread of scores value (standard deviation).
Additionally, a response distribution table is included on the page that lists the scale items and displays the item level distribution of participant responses (e.g., lists the percentage of the group that chose the response “Always/Almost Always” for item number 10 of the EQ-i 2.0 assessment). You can use this table to delve into the nuances of each subscale by detecting whether or not there are specific aspects of a subscale that the majority of group members identified as being areas of strength or as being potentially problematic. For instance, while the group may have obtained a High score on Emotional Self-Awareness, the % Distribution of Responses table may show that all members chose low responses for item 27, “Aware how own mood impacts others.” Consequently, even though the group scored highly for emotional self-awareness in general, you may still choose to engage in discussion regarding item 27 if you or the group believe improving this specific skill within emotional self-awareness will benefit the group’s performance.
Lastly, organizational implications and strategies for action are discussed to assist you in harnessing and realizing the group’s full EI potential.
Similar to the previous sections, the graphs and interpretative text on the Subscale pages will be omitted if subscales have fewer than two valid participant scores. Instead, you will be presented with the following message, “Group results could not be displayed due to omitted items.”
- Strategies for Action
This page provides a table that summarizes the strategies for action for all fifteen EQ-i 2.0 subscales. In this table, the shaded boxes identify the strategies for the group’s three highest- and three lowest-scoring subscales. Because all of the strategies for action are displayed on a single page, you may use this page as a tool for gaining group members’ buy-in or commitment to certain strategies. For example, you may ask the group to scan the strategies listed on this page and choose one strategy for each composite scale that the group is willing to work on together. Similarly, since the page highlights the strategies associated with the three lowest-scoring subscales, you can ask the group to refer to this page and develop a plan that will incorporate into their daily work routines the strategies associated with the lowest-scoring subscales. Alternatively, the group may use the strategies listed on this page as guidelines or examples while brainstorming more personalized strategies that will allow them to achieve similar goals.
- Customization Features of the EQ-i 2.0 Group Report
Coaches have the option of customizing the EQ-i 2.0 Group Report. They can:
- Add a title, logo, and/or company name to the cover pages of reports.
- Turn on/off the Spread of Scores feature in the Coach Report: While we strongly recommend leaving the Spread of Scores feature turned on because it adds important interpretative value to your report (see the “Interpretation Guidelines” section of this supplement for information on how to interpret spread of scores), you do have the option of turning this feature off if you feel it will not be beneficial to you. When the Spread of Scores feature is turned on, a brief definition of Spread of Scores will be presented in the Introduction and the actual Spread of Scores value will be included as the last row of the Group Snapshot table located on each Subscale Page.
- Turn on/off the Strategies for Action Page: The Strategies for Action Page briefly summarizes the strategies for each subscale that you may use with a group to further develop their EI skills. However, depending on the coaching style that you prefer, you may find yourself choosing to incorporate your own customized strategies into the group feedback session. Additionally, while some clients prefer to have as much information as possible, others find it easier to focus their efforts if they only have to concentrate on a few key points. Consequently, the EQ-i 2.0 Group Report is set up so that you will have the ability to turn the Strategies for Action page on or off in both the Coach and Client versions of the Group Report, depending on your preferences regarding how developmental strategies should be presented to clients.
- Overview of Group Results
While the Executive Summary shows the group averages for the three highest- and three lowest-scoring subscales, the Overview of Group Results page shows the group’s average scores for all EQ-i 2.0 composite scales and subscales, along with the average Total EI score.
Interpretation Guidelines
| Detailed information is provided in the EQ-i 2.0 User’s Handbook regarding how EI results should be interpreted. Consequently, this section of the supplement provides a brief overview on how to interpret score ranges, the mean, the spread of scores, and the selection of norms. For additional information on interpreting results, please see Part IV: Understanding the Results. |
- Minimum and Maximum Scores (Score Range)
The range of a set of scores is one method of assessing the dispersion of scores, which describes how close together or far apart scores are from each other. The range is defined as the difference between the largest and smallest score values in a data set. The formula for finding a range is:
- Range = Maximum score − Minimum score.
For example, if you have a group of five people who obtained standard scores of 80, 90, 78, 102, and 105 for Self-Regard, then the maximum score of this data set will be 105 (the highest score in this grouping) and the minimum score will be 78 (the lowest score in this grouping). The range for this group of scores will then be 105 − 78 = 27. If you are interested in calculating the range for a subscale, you may obtain the minimum and maximum scores for your group from the Group Snapshot table on the subscale pages.
- Average (Mean)
The Group Report displays the average score for the group. The average is calculated as the mean value for a group of scores. More specifically, it is the sum of all of the scores divided by the number of scores within that data set. If we continue to use the example above, we can calculate the mean as follows:
- Mean = (80 + 90 + 78 + 102 + 105) ÷ 5 = 91
Note: Because the mean is a calculated value, it does not have to be an actual score within the dataset. For example, the mean of 91 in the calculation above is not an actual score obtained by one of the group members.
Because the mean serves as one method of representing the central value of a set of scores, individuals often use it as a standard to which they compare their individual score. However, because the mean is very sensitive to extreme scores, the presence of outliers may cause the mean value to shift greatly, thereby presenting a less accurate summary of the group’s performance on a particular subscale.
- Spread of Scores (Standard Deviation)
While the Score Range describes the relationship between the maximum and minimum scores within a data set, it does not to give a clear picture as to how all the scores within a data set relate to the average (mean).
For example, we know that the group of five participants used in the previous example has a range of 27 and a mean of 91. When we examine the Self-Regard scores for a second group of five participants, we find that they obtained scores of 80, 107, 89, 88, and 89 for Self-Regard. When the range and mean for this set of scores is calculated, it shows that this group also obtained a range of 27 and a mean of 91. However, even though these two sets of scores share the same range and mean, the scores for the second group are more similar to each other (four out of five scores are in the 80s) while the scores in the first group are more spread out.
Because of this discrepancy, a more detailed measure of dispersion is needed to describe the relationship between scores within a data set. Consequently, the “spread of scores” (i.e., the standard deviation) is used to describe the average distance a set of scores is from its mean. In other words, a higher spread of scores value indicates that the scores within that group are more “spread out.” Conversely, smaller spread of scores values indicate that the scores within that group are more clustered together. If the spread of scores value is equal to zero, then all participants within a group obtained the same score.
The line graphs on the Group Pattern Analysis page can be used as a visual representation of spread of scores. A cluster of scores close to the mean indicates that the group most likely has a small spread of scores for that particular subscale (see Figure 1). However, if the scores are more “spread out” along the line, then that group will have a larger spread of scores value for that particular subscale (see Figure 2).
- Selection of Norms
- Australia, General Population – Age and Gender
- Australia, General Population – Overall
- UK/Ireland, General Population – Age and Gender
- UK/Ireland, General Population – Overall
- UK/Ireland, Professional – Age and Gender
- UK/Ireland, Professional – Overall
- US/Canada, General Population – Age and Gender
- US/Canada, General Population – Overall
- US/Canada, Professional – Age and Gender
- US/Canada, Professional – Overall
- South Africa, Professional – Age and Gender
- South Africa, Professional – Overall
Figure 1. Visual Representation of a Lower Spread of Scores

Figure 2. Visual Representation of a Higher Spread of Scores

What is the value of understanding the spread of scores or standard deviation for a subscale? You may use the spread of scores to assess how well the mean represents the data set. A small spread of scores value will signify that scores within a data set are consistently close to the mean, indicating that the mean is an accurate representation of the central point for that set of scores. For example, particular attention should be given to subscales that have low averages with a small spread of score value because this will indicate that the majority of the group obtained low scores for those subscales. However, if the spread of scores value is large, this would indicate either the scores are more spread out from the mean or, the scores can be clustered near the mean but there are a few extreme outliers present in the group. If there is increased variability in the scores as indicated by a large spread of scores value, then the mean may not be the most accurate way of representing the data set.
For example, when looking through a group’s results, you find that they obtained average subscale scores of 110 for Impulse Control and Flexibility. Based on these average scores, it seems like this group is doing fairly well in both subscales. However, when you examine the subscale pages, you notice that the spread of scores value is quite small for the Flexibility subscale but is much larger for the Impulse Control subscale. In other words, because Impulse Control has a large spread of scores value, you know that people within the group have greatly differing skills when it comes to impulse control. Consequently, you may decide to choose Impulse Control as a key focal point for the group feedback session because the variability in this subscale might be a cause of friction within the group.
Furthermore, in order for clients to view group feedback as being valid, each member of a group will need to consider it as being relevant and important. Consequently, if a group has individual scores that vary greatly for a subscale, then blanket recommendations or general developmental strategies may not be as effective because not all members of the group may need this type of feedback. Instead, if a group obtains a large “spread of scores” value for a particular subscale, you may need to take a closer look at the % Distribution of Responses per Item table to identify the specific items or areas where group members indicated similar developmental needs. By targeting your recommended strategies on those shared developmental areas, then group members can work together more effectively to enhance the emotional intelligence dynamics within their group.
Norms provide a baseline against which the group’s results will be compared. When generating the Group Report, coaches may select from the same list of norm types and norm regions that they used for the Workplace and Leadership reports. More specifically, you may choose to compare your group’s results against the following norms (Note: The list below is reflective of the norms available as of December 2013; however, you may use any norms available through the EQ-i 2.0 Portal to generate Group Reports):
While you must select a norm in order to generate a Group Report, note that you can generate Group Reports using individual assessments that were previously scored with different norm regions and norm types. For instance, if you wanted to generate a Group Report using the US/Canada, General Population – Overall norm, you may choose to include in the group one individual who had previously been scored against the US/Canada, General Population – Age and Gender norm and a second individual who was scored against the US/Canada, Professional – Age and Gender norm. However, regardless of the norms used to score their individual assessments, both participants will now be scored using the norm that you chose for the Group Report.
Because standards scores vary depending on the norms selected, there may be slight discrepancies between individual- and group-level results if individual assessments were scored using different norms than that which was chosen for the Group Report.
Norm selection will be restricted if any participants within a group did not provide age/gender information. In this case, the entire group will be scored against the overall norm. For example, if you selected three participants into a group and you wanted to generate a Group Report that used the Australia, General Population – Age and Gender norm but one of the participants did not provide age and/or gender information, then the following error message will be displayed: “You have included participants for whom the age and gender is not known. To ensure consistency, all participants in the group will be scored against the Australia General Population - Overall norm.”
| For further information about norms and the interpretation of standard scores, see Part IV: Understanding the Results. |
While all of MHS’s products, both past and existing, are based on solid foundations of research, we believe in constantly striving for ways to improve our products to better accommodate the changing needs of our customers and society. The Group Report has been re-designed to present group results in more efficient and visually appealing ways, and we hope the increased functionality of the EQ-i 2.0 Group Report will be beneficial to your efforts as you help clients develop their potential.