


Appendix K. EQ-i 2.0 Dutch Norms
This appendix presents the statistical results pertaining to the development of the EQ-i 2.0 Dutch Norms.
- Table K.1. Age by Gender Distribution of the EQ-i 2.0 Dutch Normative Sample
- Table K.2. Geographic Distribution of the EQ-i 2.0 Dutch Normative Sample by Region
- Table K.3. Geographic Distribution of the EQ-i 2.0 Dutch Normative Sample by Province
- Table K.4. Education Level Distribution in the EQ-i 2.0 Dutch Normative Sample
- Table K.5. Employment Status Distribution in the EQ-i 2.0 Dutch Normative Sample
- Table K.6. Occupation Area Distribution in the EQ-i 2.0 Dutch Normative Sample
- Table K.7. Effect Sizes for Gender and Age Effects in the EQ-i 2.0 Dutch Normative Sample
- Table K.8. Gender Differences in the EQ-i 2.0 Dutch Normative Sample
- Table K.9. Age Differences in the EQ-i 2.0 Dutch Normative Sample
- Figure K.1. Histogram of EQ-i 2.0 Total EI Standard Scores in the Dutch Normative Sample
- Table K.10. Internal Consistency of EQ-i 2.0 Scales in the Dutch Normative Sample
- Table K.11. Correlations Among EQ-i 2.0 Composite Scales in the Dutch Normative Sample
- Table K.12. Correlations Among EQ-i 2.0 Subscales and Scales in the Dutch Normative Sample
Table K.1. Age by Gender Distribution of the EQ-i 2.0 Dutch Normative Sample
The following table presents the distribution of the EQ-i 2.0 Dutch normative sample, categorized by age group and gender. Age ranges were stratified to match targets obtained from the 2014 Netherlands Census. For each age group, an approximately equal number of men and women were sampled.
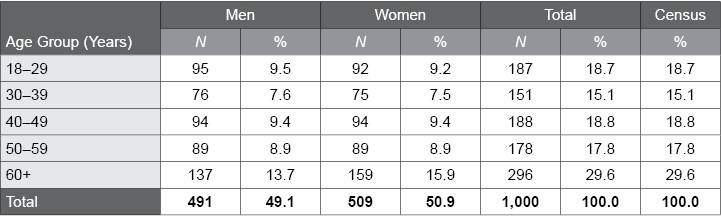
Table K.2. Geographic Distribution of the EQ-i 2.0 Dutch Normative Sample by Region
The following table presents the geographic distribution for the EQ-i 2.0 Dutch normative sample by region.
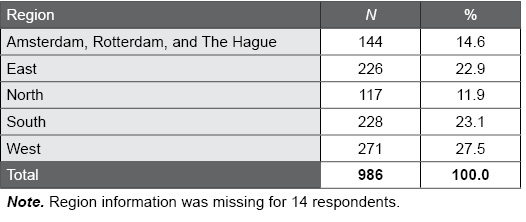
Table K.3. Geographic Distribution of the EQ-i 2.0 Dutch Normative Sample by Province
The following table presents the geographic distribution of the EQ-i 2.0 Dutch normative sample by province.
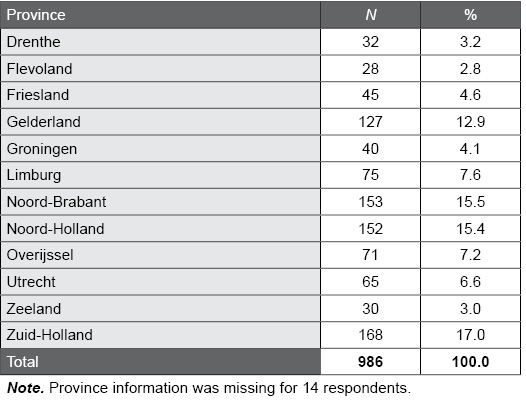
Table K.4. Education Level Distribution in the EQ-i 2.0 Dutch Normative Sample
The following table summarizes the education level distribution of the EQ-i 2.0 Dutch normative sample. Most applications of the EQ-i 2.0 in the Netherlands (and in other countries) are within professional contexts; as such, 40.4% of the sample had completed higher professional education or university education.
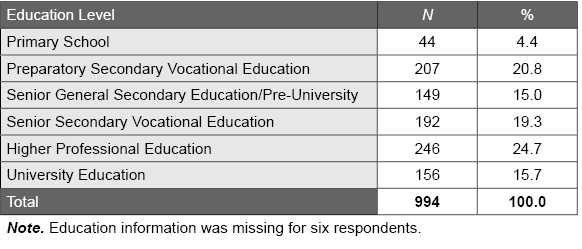
Table K.5. Employment Status Distribution in the EQ-i 2.0 Dutch Normative Sample
The following table summarizes the employment status distribution of the EQ-i 2.0 Dutch normative sample.
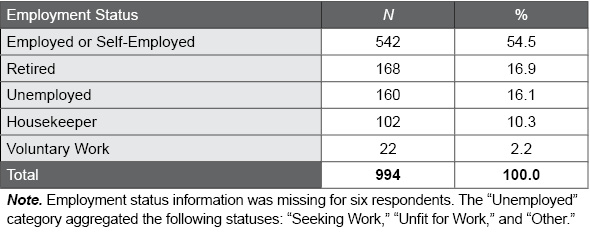
Table K.6. Occupation Area Distribution in the EQ-i 2.0 Dutch Normative Sample
The following table summarizes the occupation area distribution of those who reported being “Employed or Self-Employed” in the EQ-i 2.0 Dutch normative sample.
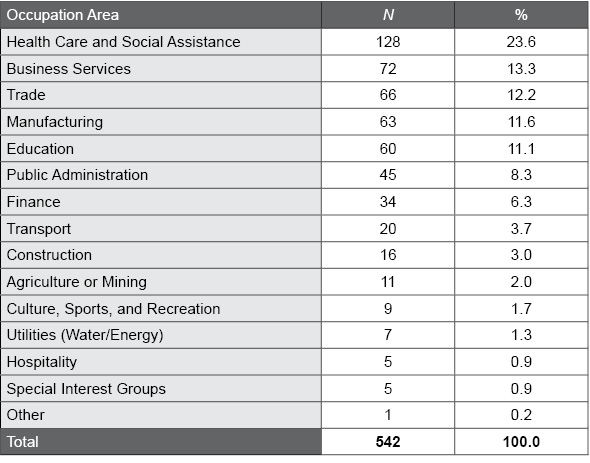
Table K.7. Effect Sizes for Gender and Age Effects in the EQ-i 2.0 Dutch Normative Sample
The following table summarizes the effect sizes for the effects of gender and age on the EQ-i 2.0 Total EI score, composite scales, and subscales in the Dutch normative sample. Analyses were conducted with the standard scores from the overall norm group. Meaningful effect sizes (i.e., |d| ≥ 0.20, partial η2 ≥ .01) suggest important differences among participants based on the demographic variable.
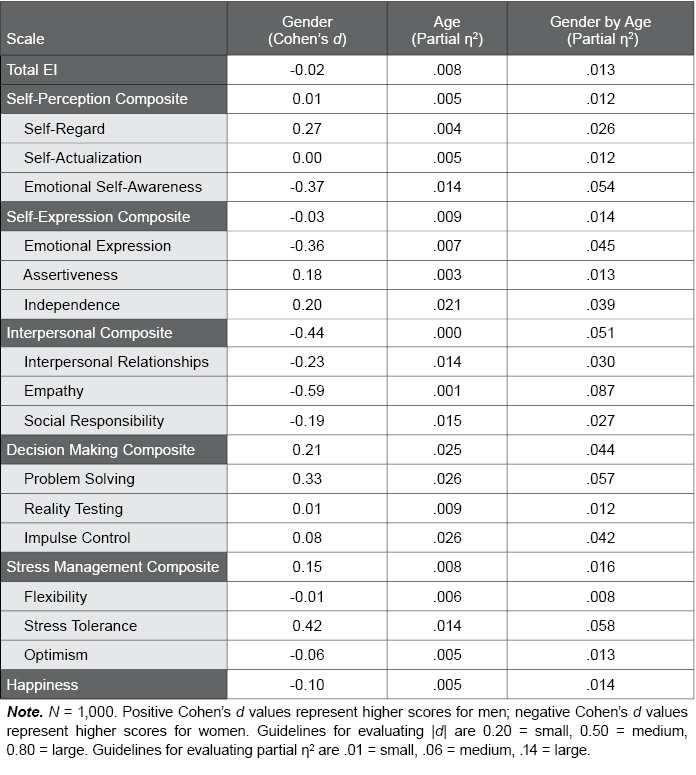
Table K.8. Gender Differences in the EQ-i 2.0 Dutch Normative Sample
The following table provides EQ-i 2.0 standard score scale means and standard deviations for men and women in the EQ-i 2.0 Dutch normative sample. Analyses were conducted with the standard scores from the overall norm group. F and p values convey the statistical significance of gender differences; p values lower than .01, which were found for 12 scales, indicate statistically significant differences between men and women.
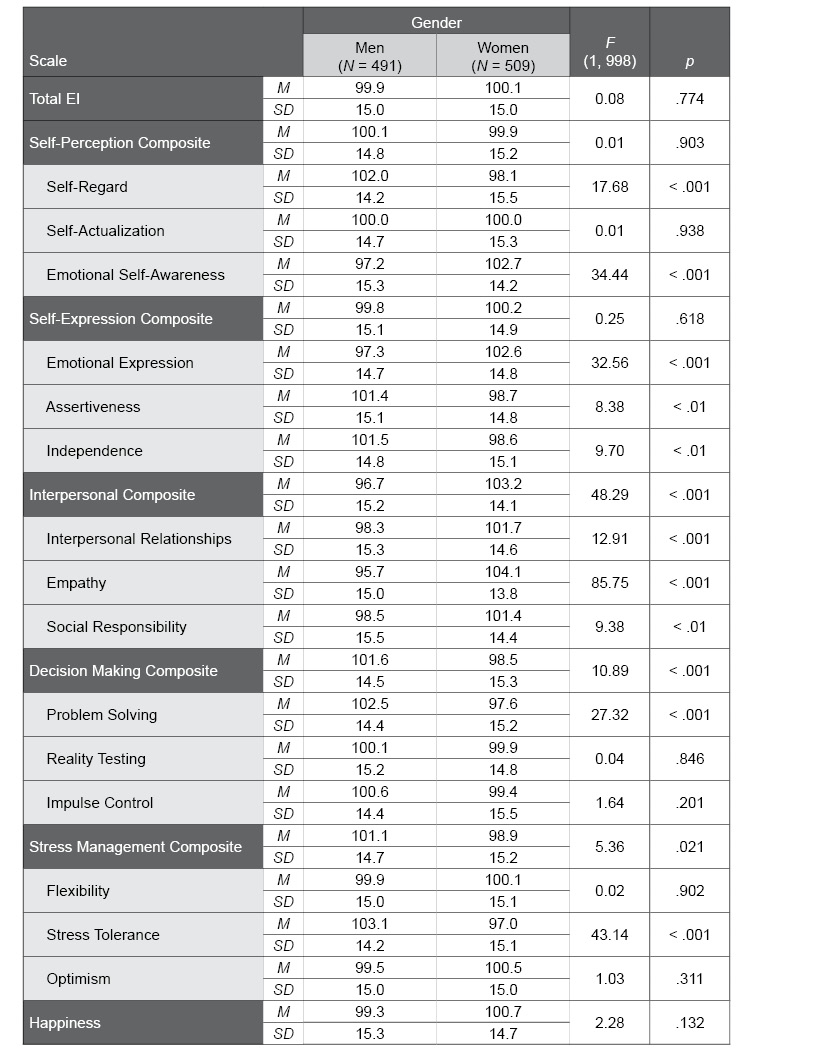
Table K.9. Age Differences in the EQ-i 2.0 Dutch Normative Sample
The following table provides EQ-i 2.0 standard score scale means and standard deviations for the various age groups in the EQ-i 2.0 Dutch normative sample. Analyses were conducted with the standard scores from the overall norm group. F and p values convey the statistical significance of age differences; p values lower than .01, which were found for eight scales, suggest statistically significant differences among the age groups.
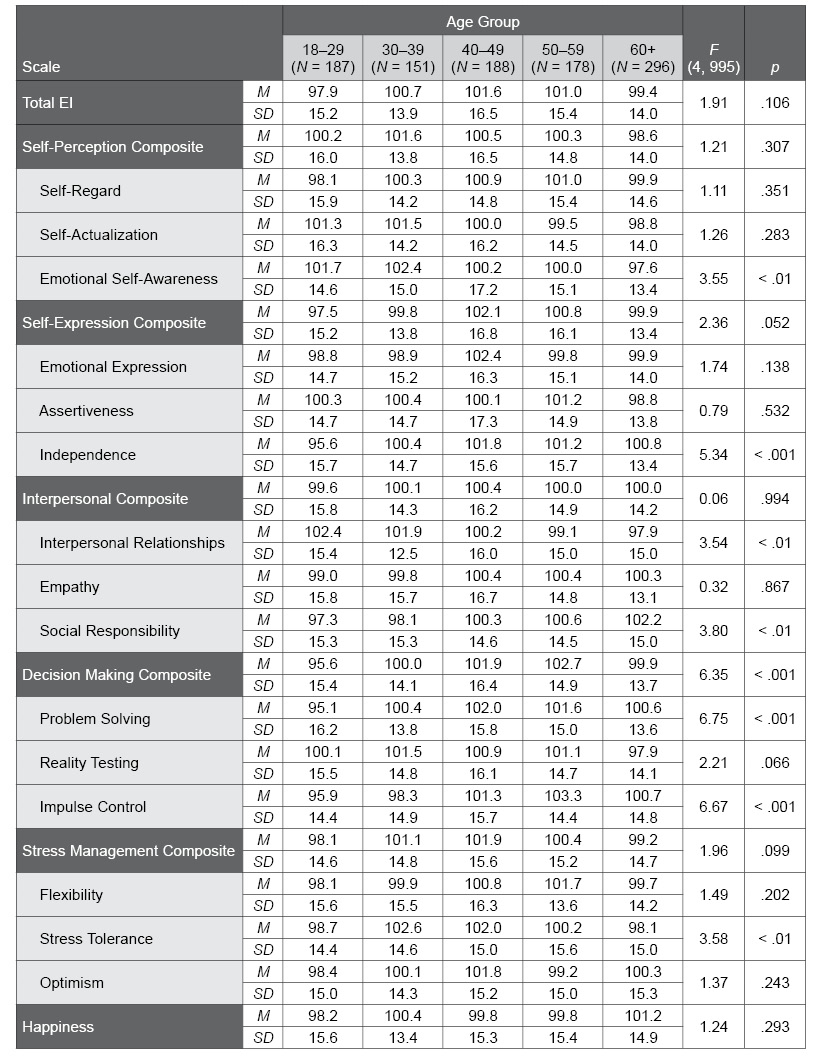
Figure K.1. Histogram of EQ-i 2.0 Total EI Standard Scores in the Dutch Normative Sample
This figure illustrates the distribution of EQ-i 2.0 Total EI standard scores in the EQ-i 2.0 Dutch normative sample. The distribution of the actual scores approximates the normal bell-shaped (Gaussian) curve (shown using the black curved line), which suggests that it is unnecessary to apply a normalizing transformation to the scores. Distributions for most other composite scales and subscales show a similar pattern, most with a slight negative skew.
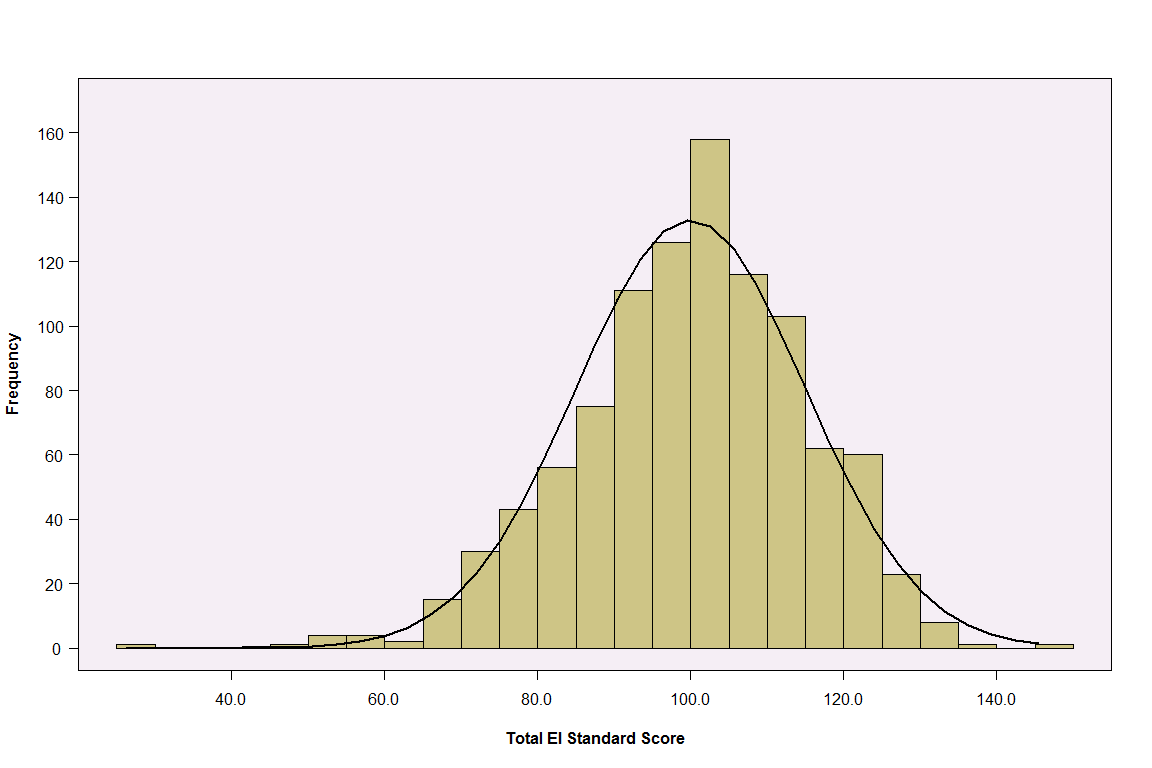
Table K.10. Internal Consistency of EQ-i 2.0 Scales in the Dutch Normative Sample
The following table summarizes the internal consistency (Cronbach's alpha) values for the EQ-i 2.0 scales in the EQ-i 2.0 Dutch normative sample, presented overall and separately by gender and age norm group. Alpha values range from 0.00 to 1.00, with high values providing evidence for the strong reliability of the EQ-i 2.0.
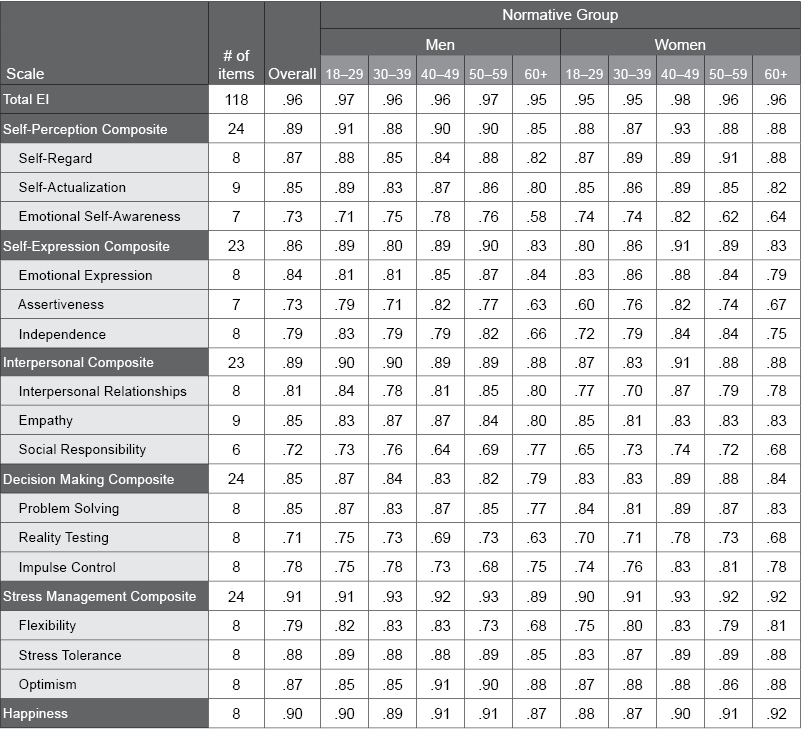
Table K.11. Correlations Among EQ-i 2.0 Composite Scales in the Dutch Normative Sample
The following table illustrates the correlations among the EQ-i 2.0 composite scales in the EQ-i 2.0 Dutch normative sample. The correlations seen here range from .35 to .72, with higher values suggesting that the scales are interrelated and measure a common construct (i.e., emotional intelligence). Very high values (e.g., r > .90) would suggest a unidimensional factor structure. Moderate to large correlations, like those found in the Dutch normative sample, support both the concept that the scales measure an underlying common construct and the multidimensional factor structure of the EQ-i 2.0.
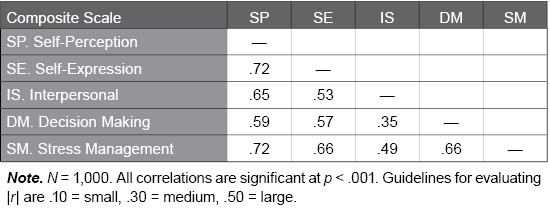
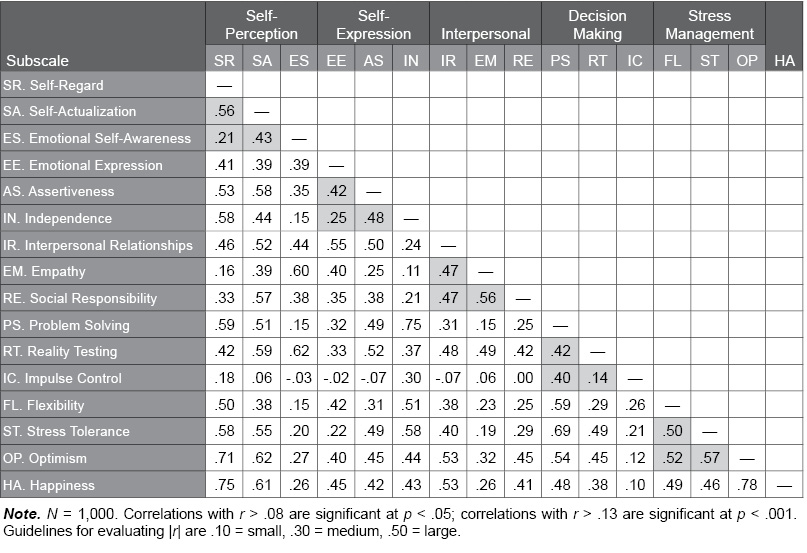
Table K.12. Correlations Among EQ-i 2.0 Subscales in the Dutch Normative Sample
The following table illustrates the correlations among the EQ-i 2.0 subscales in the EQ-i 2.0 Dutch normative sample. The correlations seen here range from |r| = .00 to .78, with higher values suggesting the scales share a common psychological characteristic. Shaded cells indicate correlations between subscales within the same composite scale. For the most part, moderate to large correlations were found within the composite scales, supporting the multidimensional factor structure of the EQ-i 2.0.