Part V: creating the EQ-i 2.0 and EQ 360 2.0
Global Norms
EQ-i 2.0 Global Norms Standardization
This section describes the psychometric properties of the EQ-i 2.0 Global Norms, including standardization, reliability, and validity information.
| All tables and figures representing detailed depictions of the analyses described in this chapter are available in Appendix H. |
NORMATIVE SAMPLE
Data for the EQ-i 2.0 Global normative sample (N = 10,000) were collected from June 2011 to October 2013, in 154 countries across 5 world regions (Africa, the Americas, Asia, Europe, and Oceania; see Table H.1). The world regions used to form the EQ-i 2.0 Global normative sample were based on the United Nations composition of macro geographical (continental) regions. Five geographical regions were identified, each being composed of between three and five geographical sub-regions. Table H.2 presents the geographic distribution of the normative sample within each world region and sub-region. More information can be found on the United Nations Statistics Division website at the following URL:
http://unstats.un.org/unsd/methods/m49/m49regin.htm
Data were collected from the EQ-i 2.0 customer database. From the available data, cases with specified age, gender, country, and occupation information were considered for inclusion in the normative sample. From each world region, 2,000 cases meeting age and gender targets were then randomly selected. Figure 1 below illustrates the geographical breakdown of the Global Norm. The legend corresponds to the number of EQ-i 2.0 respondents from each country that are included in the Global Norm.
Figure 1. Global Norm Breakdown and Visual Representation by Country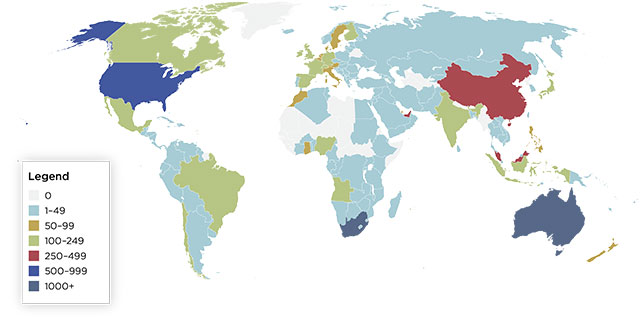
The normative sample was evenly proportioned by gender within each of four age intervals (i.e., 18–29, 30–39, 40–49, and 50+; see Table H.3). Additionally, there were equal numbers of men and women in each world region. The sample breakdown by occupation area is shown in Table H.4, with the largest proportions working in the areas of business management and related occupations (31.3%), financial services (11.8%), marketing and sales occupations (10.4%), and engineering and related technologists and technicians (8.4%).
NORMING PROCEDURES
The first step in the preparation of the Global Norms was to determine if any age, gender, or regional trends existed in the data. A series of analyses of variance (ANOVA; for the Total EI score) and multivariate analyses of variance (MANOVAs; for the composites and subscales) were used to examine the relationships between gender, age, and world region with EQ-i 2.0 scores. To better control for Type I errors that might occur with multiple analyses, a more conservative criterion of p < .01 was used for all F-tests to test for statistical significance. These results are described in detail below.
Gender Effects. Results of the gender analyses showed that men and women did not differ significantly on the Total EI score, indicating that overall emotional intelligence as measured by the EQ-i 2.0 is about the same for men and women. However, small effects were seen on a number of scales (see Table H.5 for effect sizes and Table H.6 for descriptive statistics and significance test results). The largest gender difference seen in the Global normative sample was on the Empathy subscale, with women scoring higher than men (d = -0.45). Women also scored higher than men on the Emotional Self-Awareness (d = -0.31) and Emotional Expression (d = -0.31) subscales, as well as the Interpersonal Composite (d = -0.28). Men scored higher than women with small effect sizes on the Problem Solving (d = 0.27), Stress Tolerance (d = 0.27), and Self-Regard (d = 0.20) subscales.
Age Effects. Small effects of age were found on a number of scales, with the largest effect seen on the Independence subscale (partial η2 = .026). Smaller effects were observed on the Problem Solving (partial η2 = .019), Reality Testing (partial η2 = .015), Stress Tolerance (partial η2 = .014), Social Responsibility (partial η2 = .013), and Optimism (partial η2 = .011) subscales, as well as the Total EI score (partial η2 = .015) and the Self-Expression (partial η2 = .018), Decision Making (partial η2 = .017), and Stress Management composites (partial η2 = .014). For each of these scales, EQ-i 2.0 scores increased as age increased (i.e., EI was higher for older participants). See Table H.5 for effect sizes and Table H.7 for descriptive statistics and significance test results.
Regional Effects. Significant effects of region were observed on all scales, with small effect sizes at the overall level; see Table H.5 for overall effect sizes and Table H.8 for descriptive statistics and significance test results. An examination of the means in Table H.8 revealed that overall, the Asian sample tended to score lower than the samples from the other regions, while the African sample tended to have the highest scores. To further explore regional differences in EQ-i 2.0 scores, effect sizes (Cohen’s d) were computed for each pairwise comparison across the five regions, described below (see Tables H.9a–e).
Asia: Of the five regions, the sample from Asia had the lowest scores (see Table H.9a). Small to moderate effect sizes were found on most scales, with lower scores for Asia compared to Africa (median d = -0.39), the Americas (median d = -0.31), Europe (median d = -0.26), and Oceania (median d = -0.21).
Africa: With very few exceptions, the sample from Africa had the highest scores (see Table H.9b). An examination of the pairwise differences revealed few meaningful effects between Africa and the Americas (median d = 0.12); however, the African sample had higher scores than the Asian sample (median d = 0.39) and, to a lesser extent, the samples from Oceania (median d = 0.16) and Europe (median d = 0.15).
Americas: The sample from the Americas had higher EQ-i 2.0 scores compared to the sample from Asia (median d = 0.31; see Table H.9c). Except for a few scales with small effects, scores for the Americas were about the same as scores for Africa (median d = -0.12), Oceania (median d = 0.07), and Europe (median d = 0.03).
Europe: The European sample had higher scores than the Asian sample for the majority of the scales (median d = 0.26; see Table H.9d), and lower scores than the African sample on several scales (median d = -0.15). Comparisons between Europe and both the Americas (median d = -0.03) and Oceania (median d = 0.05) showed scores to be about the same with few meaningful differences.
Oceania: The sample from Oceania had higher scores than the Asian sample for the majority of the scales (median d = 0.21; see Table H.9e), and lower scores than the African sample on several scales (median d = -0.16). Comparisons between Oceania and both the Americas (median d = -0.07) and Europe (median d = -0.05) showed scores to be about the same with few meaningful differences.
Interaction Effects. None of the interaction effects (i.e., Gender × Age, Gender × Region, Age × Region, Age × Gender × Region) reached the minimum partial η2 criterion for a small effect size (see Table H.10). Overall, age effects were largely consistent within men and women, and gender effects were largely consistent across age groups. Similarly, age and gender effects were consistent within each region.
Norm Groups and Norm Construction. As seen with all other EQ-i 2.0 norm releases to date (i.e., North America, UK and Ireland, Australia, and South Africa), the age and gender analyses revealed a number of significant effects. Therefore, specific Age and Gender Norms, as well as Overall Norms (i.e., collapsed across age groups and genders), were both developed. Some meaningful differences were also found across world regions; however, the current release does not include separate norms on this basis. Regional or continental norms are being considered for future development.
Results revealed that skewness and kurtosis values were not large enough to suggest that a normalizing transformation was necessary (skewness values ranged from -1.08 to -0.30; kurtosis values ranged from -0.11 to 1.49), and an examination of the scale histograms did not reveal any significant departures from a bell-shaped (Gaussian) curve (Figure H.1 shows a histogram for the EQ-i 2.0 Global normative sample Total EI score). Actual construction of the norms was conducted in the same manner as the North American Norms, including the use of statistical smoothing (see Standardization, Reliability, and Validity for more information on the construction of the North American General Population Norms).
Internal Consistency
Internal consistency, a measure of reliability, conveys the degree to which a set of items are associated with one another. A high level of internal consistency suggests that the set of items are measuring a single, cohesive construct. Internal consistency is typically measured using Cronbach’s alpha (Cronbach, 1951). Cronbach’s alpha ranges from 0.0 to 1.0 and is a function of both the interrelatedness of the items in a test or scale and the length of the test (John & Benet-Martinez, 2000). Higher values reflect higher internal consistency.
Cronbach’s alpha values for the EQ-i 2.0 scales for the Global normative sample are presented overall and by age and gender in Table H.11, and by world region in Table H.12. Although there is no universal criterion for a “good” alpha level, informal cutoffs for evaluating alpha are typically .90 is “excellent,” .80 is “good,” .70 is “acceptable,” and lower than .70 is “questionable.” Most of the values found in Tables H.11 and H.12 demonstrate good or excellent reliability, and none fall below the acceptable range. These values are particularly favorable given the relatively small number of items included in most subscales. For the overall sample, the alpha value of the Total EI scale was .96, values for the composite scales ranged from .85 to .90, and values for the subscales ranged from .74 to .87. Similar patterns were seen across the age and gender normative groups and across world regions, including a Total EI alpha value of .96 or higher for each group.
The high level of internal consistency found in the Total EI score supports the idea that the EQ-i 2.0 items are measuring a single, cohesive construct, namely emotional intelligence. The same can be said of the individual components of emotional intelligence that make up the EQ-i 2.0 (i.e., the composite scales and subscales).
Factorial Validity
EXPLORATORY FACTOR ANALYSIS
Exploratory factor analysis (EFA) was used to determine whether the subscales established with the North American EQ-i 2.0 normative data empirically emerge from the Global normative dataset. Five EFAs were conducted, analyzing the items within each composite scale separately. In each EFA, a three-factor solution was forced to examine whether the items corresponding to each subscale within the composite loaded together in the Global normative data. As with the North American normative data, principal axis factoring extraction was used, with direct oblimin (i.e., oblique) rotation, as the factors within each composite are expected to correlate with each other. Reverse scoring was applied to relevant items prior to the analysis. Factor loadings were considered significant if they reached at least ± .30, and an item was defined as cross-loading if it was significant on more than one factor and had loadings within .10 of each other on these factors.
For the Self-Perception Composite EFA, items for the Self-Regard, Self-Actualization, and Emotional Self-Awareness subscales loaded together as expected by the established factor structure (i.e., items loading significantly onto their respective factors, with no cross-loadings).
For the Self-Expression Composite EFA, all items loaded significantly onto their respective factors for the Emotional Expression, Assertiveness, and Independence subscales, with no cross-loadings.
For the Interpersonal Composite EFA, items for the Interpersonal Relationships, Empathy, and Social Responsibility subscales loaded onto their respective factors, with the exception of one Interpersonal Relationships item with a factor loading of .25, which is just below the cutoff.
For the Decision Making Composite EFA, all Problem Solving, Reality Testing, and Impulse Control items loaded onto their respective factors, with no cross-loadings.
For the Stress Management Composite EFA, all Flexibility, Stress Tolerance, and Optimism items loaded onto their respective factors, with no cross-loadings.
To summarize, the EFAs generated solutions that strongly correspond to the established EQ-i 2.0 factor structure, with the items for each subscale empirically grouping together onto the expected factors. These results demonstrate validity for the use of the EQ-i 2.0 in a global context.
CORRELATIONS AMONG EQ-i 2.0 COMPOSITE SCALES AND SUBSCALES
Correlations among the EQ-i 2.0 composite scales and subscales were examined, and it was expected that these correlations would generally be high, given that they are all measuring the same underlying construct of emotional intelligence; however, they should not be so high as to indicate redundancy between the scales. Correlations observed in the Global normative sample are presented in Tables H.13 (composite scales) and H.14 (subscales).
The composite scale correlations ranged from r = .44 (Interpersonal with Decision Making) to r = .70 (Stress Management with both Self-Perception and Decision Making; Self-Expression with Self-Perception), with an average correlation of r = .62. For the subscales, correlations ranged from r = .08 (Independence with Empathy) to r = .74 (Happiness with both Self-Regard and Optimism), with an average correlation of r = .42. As highlighted in Table H.14, subscale correlations within composite scales ranged from r = .21 (Emotional Expression with Independence) to r = .60 (Self-Regard with Self-Actualization). These results support the notion that a single, underlying dimension is being represented in the EQ-i 2.0, yet the values are not overly high and there is enough variation in the correlations to provide clear evidence of the multidimensional nature of the assessment, and support the existence of composite scales and subscales. The relationships among scales observed here are similar to patterns seen with the previous EQ-i 2.0 norms released to date (i.e., North America, UK and Ireland, Australia, and South Africa).
Concluding Remarks
While all of MHS’s products, both past and existing, are based on solid foundations of research, we believe in constantly striving for ways to improve our products to better accommodate the changing needs of our customers and society. The Global Norm has been developed to provide EQ-i 2.0 results within a global perspective and we hope the addition of this norm will be beneficial to your efforts as you help clients to develop their potential.