


Appendix B: EQ-i® 2.0 North American Professional Norm Sample
This appendix details the statistical results pertaining to the development of the EQ-i® 2.0 Professional Norm sample. Please see North American Professional Norms for full interpretive text.
- Table B.1. Age x Gender Distribution of the EQ-i 2.0 Professional Norm Sample
- Table B.2. Employment Area Distribution of the EQ-i 2.0 Professional Norm Sample
- Table B.3. Multivariate Effects of Age and Gender
- Table B.4. Effect Sizes for Gender and Age Effects in the EQ-i 2.0 Professional Norm Sample
- Table B.5. Gender Differences in EQ-i 2.0 Scores: Professional Norm Sample
- Table B.6. Age Differences in EQ-i 2.0 Scores: Professional Norm Sample
- Table B.7. Internal Consistency: EQ-i 2.0 Professional Normative Sample
- Table B.8. Comparison of Standard Scores from the General Population Norm Sample and Professional Norm Sample (Computed with General Population Norms)
- Table B.9. EQ-i 2.0 Customers Scored with Professional Norms
- Figure B.1. Histogram of EQ-i 2.0 Total EI Standard Scores in the Customer Sample
Table B.1. Age x Gender Distribution of the EQ-i 2.0 Professional Norm Sample
The following table conveys the distribution of participants in the EQ-i 2.0 Professional Norm sample, categorized by age group and gender. An ideal distribution is one that is similarly proportioned across all groups. The EQ-i 2.0 Professional Norm sample represents an ideal distribution because it demonstrates equal representation of all age × gender groups, until age 60+ where there are fewer cases (due to retirements).
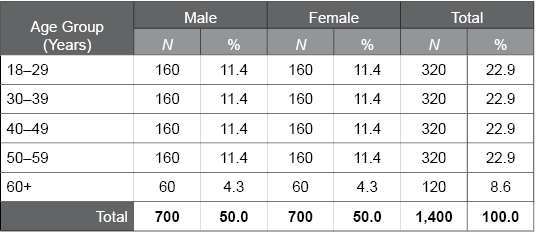
Table B.2. Employment Area Distribution of the EQ-i 2.0 Professional Norm Sample
The following table summarizes the employment area distribution of the EQ-i 2.0 Professional Norm sample. The sample should ideally include participants from a variety of employment areas, as is the case for this sample.
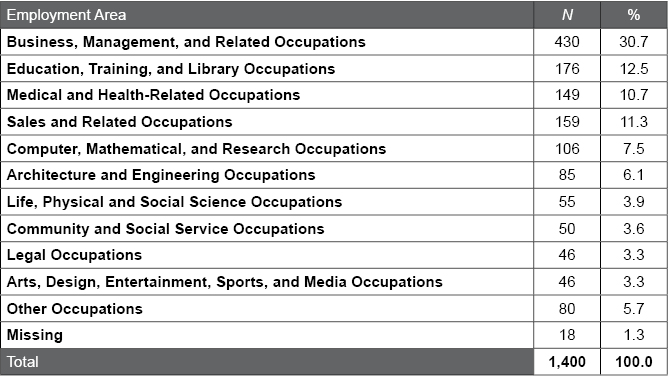
Table B.3. Multivariate Effects of Age and Gender
The following table summarizes the results from the multivariate analyses of covariance (MANCOVAs) conducted on the composite scales and subscales to examine potential effects of gender, age, and the interaction between gender and age on EQ-i 2.0 scores in the Professional Norm sample. Wilks’ lambda ranges from 0.00 to 1.00 and depicts the amount of variance not explained by the demographic variable. F and p values convey the statistical significance of the demographic variables. Partial η2 values provide an effect size for describing the effects as small, medium, or large. Meaningful effect sizes (i.e., partial η2 ≥ .01) suggest differences among participants based on the demographic variable.
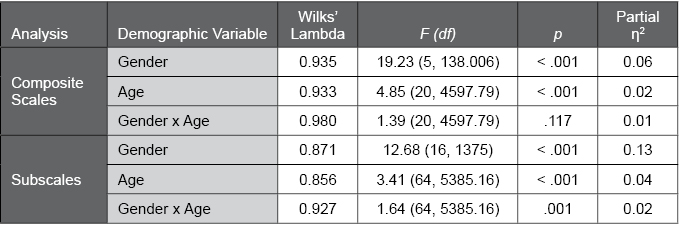
Table B.4. Effect Sizes for Gender and Age Effects in the EQ-i 2.0 Professional Norm Sample
The following table summarizes the effect sizes for gender, age, and the gender × age interaction on the EQ-i 2.0 Total EI score, composite scales, and subscales in the Professional Norm sample. Meaningful effect sizes (i.e., |d| ≥ .20, partial η2 ≥ .01) were found for several EQ-i 2.0 composite scales and subscales, suggesting differences among participants based on age and gender, and the need for separate age x gender norm groups.
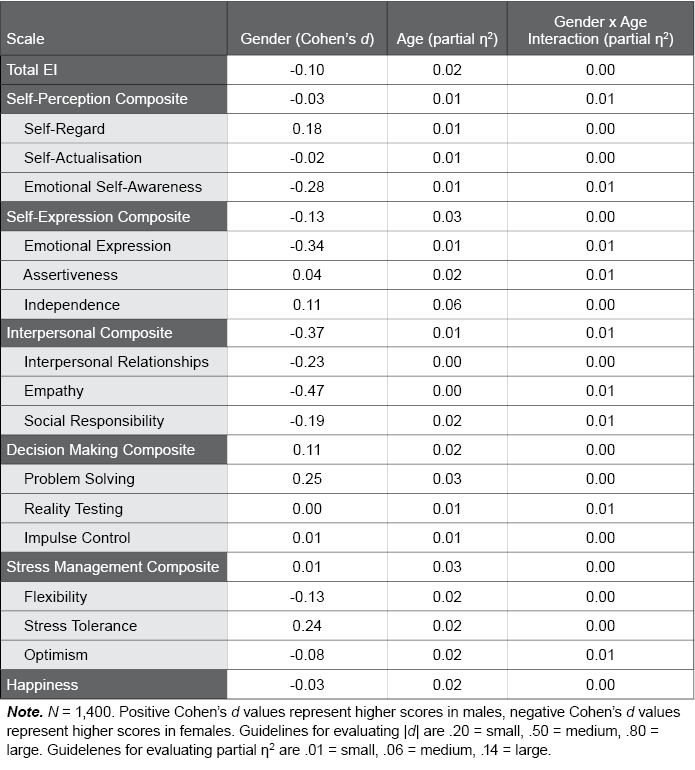
Table B.5. Gender Differences in EQ-i 2.0 Scores: Professional Norm Sample
The following table provides EQ-i 2.0 means and standard deviations for males and females in the Professional Norm sample. F and p values convey the statistical significance of gender differences. A p value less than .01, which was found for many EQ-i 2.0 composite scales and subscales, suggests a significant difference between males and females.
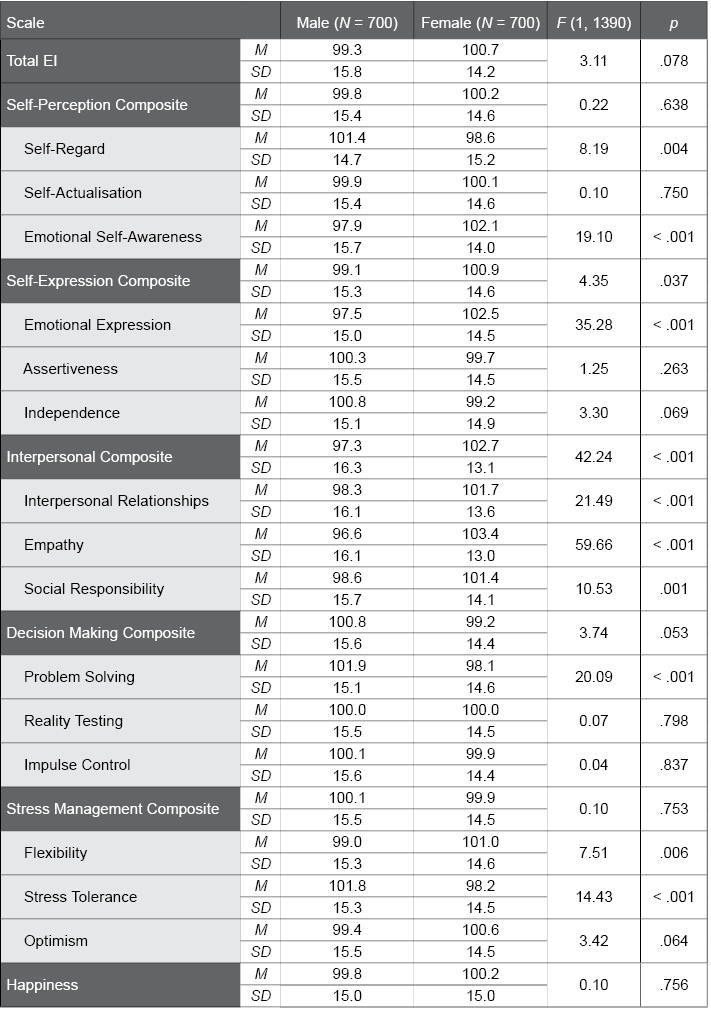
Table B.6. Age Differences in EQ-i 2.0 Scores: Professional Norm Sample
The following table provides means and standard deviations for the EQ-i 2.0 Total EI score, composite scales, and subscales for the various age groups in the EQ-i 2.0 Professional Norm sample. F and p values convey the statistical significance of age differences. A p value less than .01 were found for many EQ-i 2.0 composite scales and subscales, suggests an overall difference among the age groups.
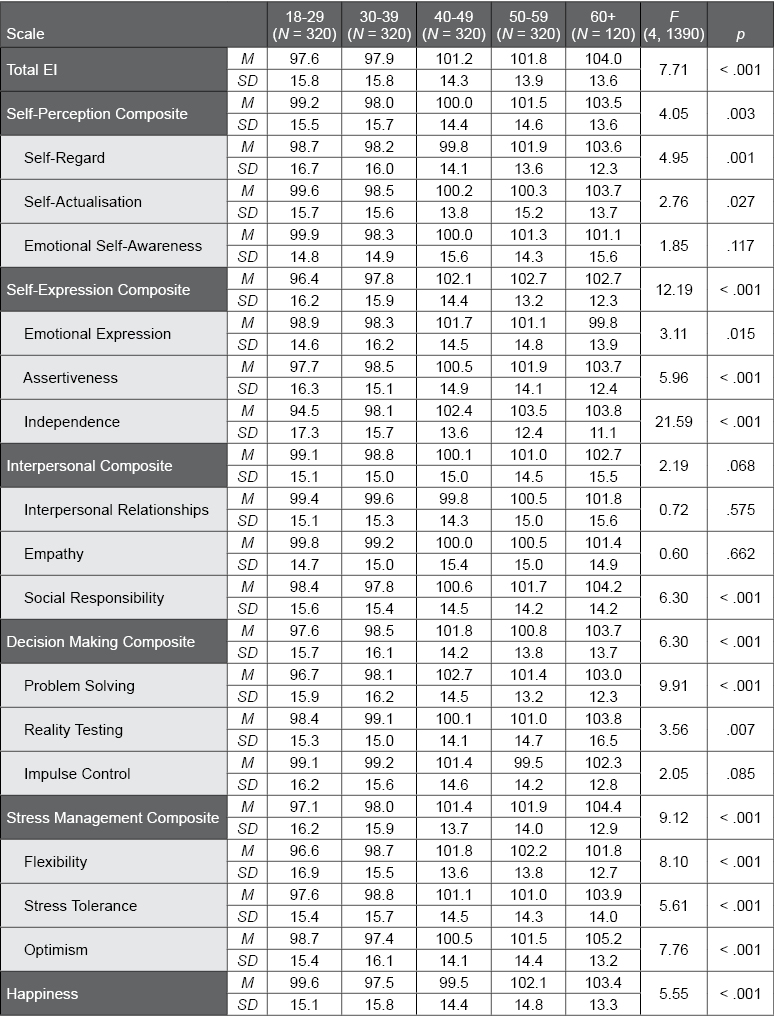
Table B.7. Internal Consistency: EQ-i 2.0 Professional Normative Sample
The following table summarizes the internal consistency (Cronbach’s alpha) values for the EQ-i 2.0 Total EI score, composite scales, and subscales in the EQ-i 2.0 Professional Norm groups. Alpha values range from 0.00 to 1.00. Higher values, like those found for this sample, provide evidence for strong reliability.
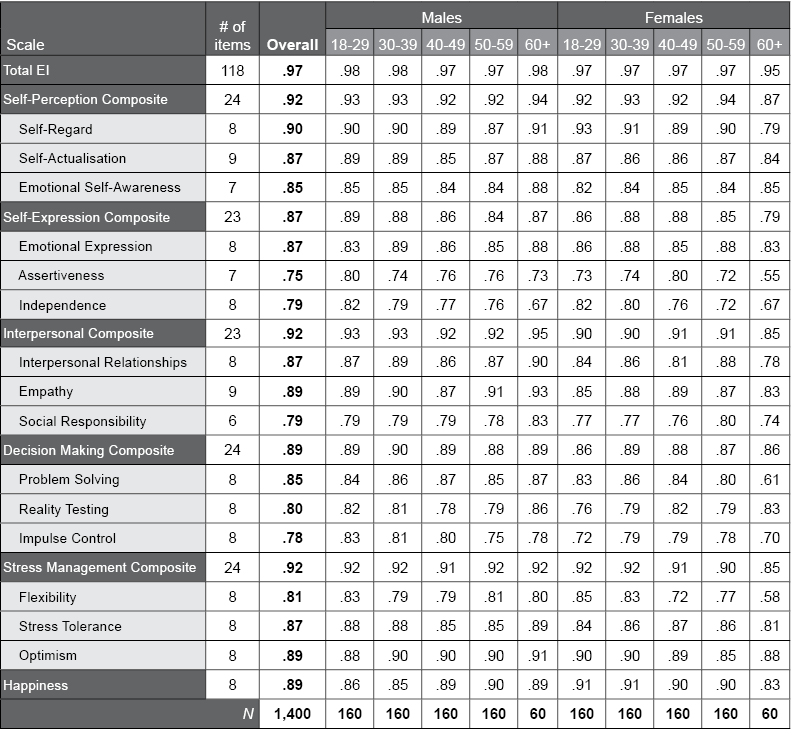
Table B.8. Comparison of Standard Scores from the General Population Norm Sample and Professional Norm Sample (Computed with General Population Norms)
The following table provides mean and standard deviations of EQ-i 2.0 scores from the General Population Norm and Professional Norm samples. The differences between the two samples are provided. The magnitude and valence of these differences indicates higher mean scores in the Professional Norm sample.
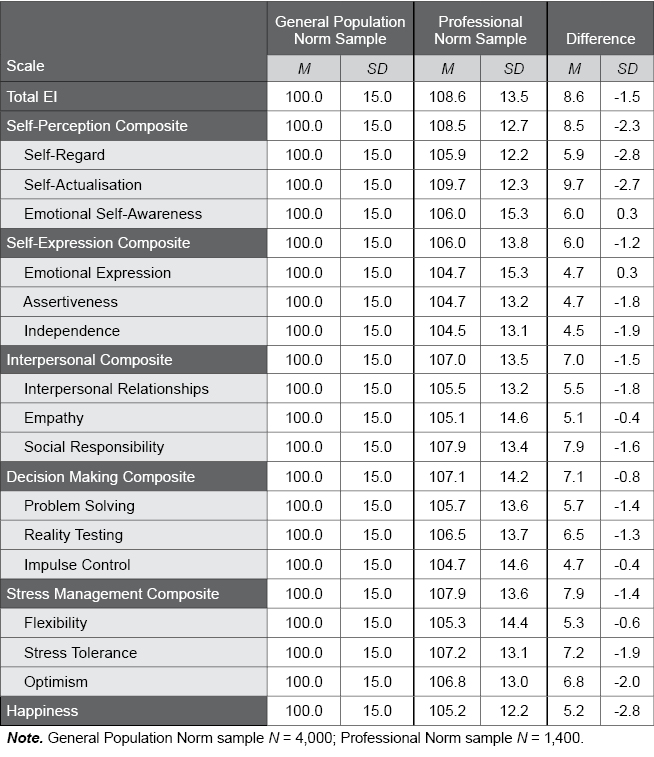
Table B.9. EQ-i 2.0 Customers Scored with Professional Norms
The following table provides mean and standard deviations for EQ-i 2.0 scores in a customer sample (N = 4,000) when scored with the Professional Norms. Ms were all close to 100, and SDs were close to 15, indicating that the professional norms will produce scores that appropriately reflect typical EI skill among professionals.
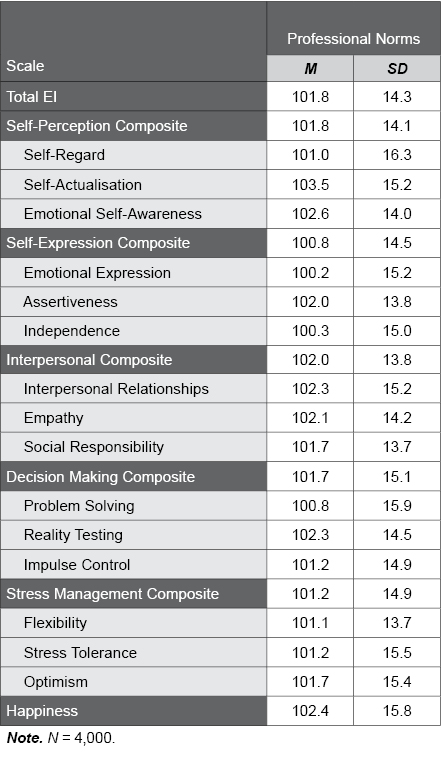
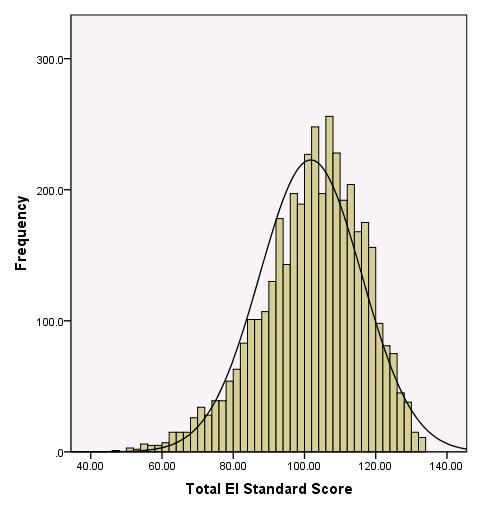
Figure B.1. Histogram of EQ-i 2.0 Total EI Standard Scores in the Customer Sample
This figure illustrates the distribution of EQ-i 2.0 Total EI scores in the customer sample (N = 4,000) when scored with the Professional Norms. Distributions that approximate a normal (“bell-shaped”) curve (as indicated by the black curved line), such as those found in this figure, suggest that the Total EI scores for the customer sample closely approximate a bell-shaped (Gaussian) distribution.