Appendix I. EQ-i 2.0 Danish Norms
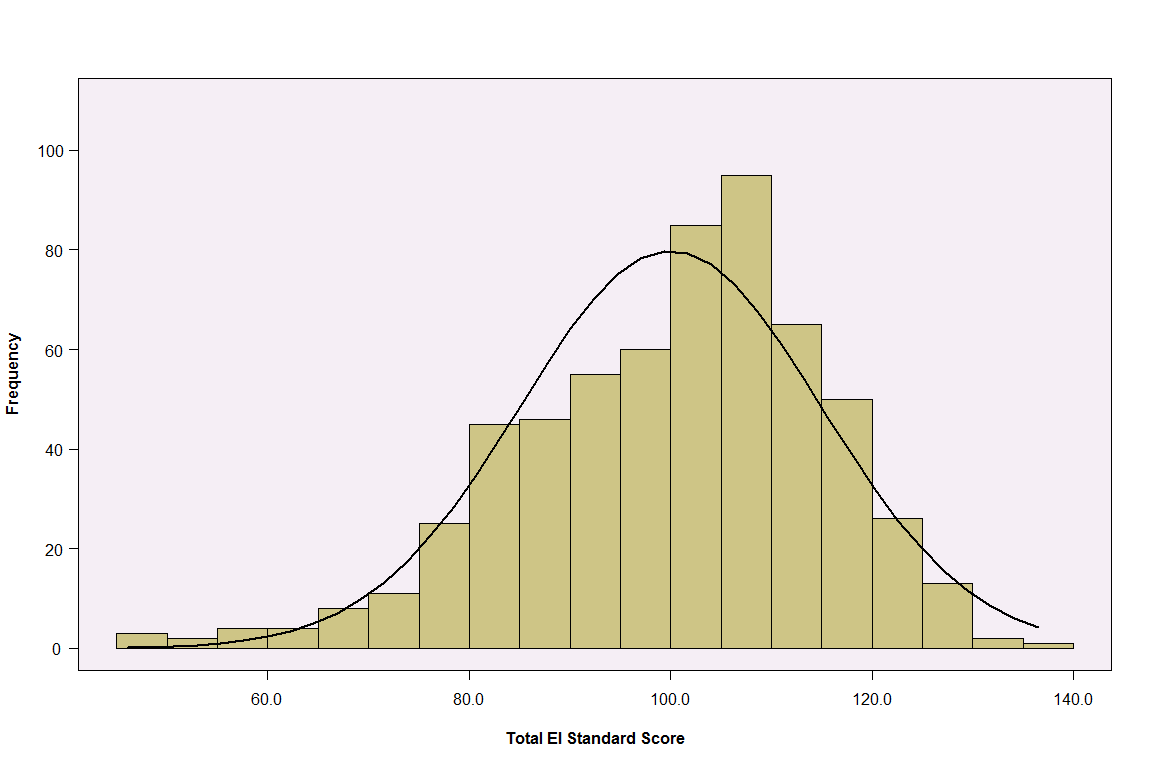
Figure J.1. Histogram of EQ-i 2.0 Total EI Standard Scores in the Danish Normative Sample
This figure illustrates the distribution of EQ-i 2.0 Total EI standard scores in the EQ-i 2.0 Danish normative sample. The distribution of the actual scores approximates the normal “bell-shaped” curve (shown using the black curved line), which suggests that it is unnecessary to apply a normalizing transformation to the scores. Distributions for most other composite scales and subscales show a similar pattern, some with a slight negative skew.