Appendix F: EQ 360 2.0 South African Norms
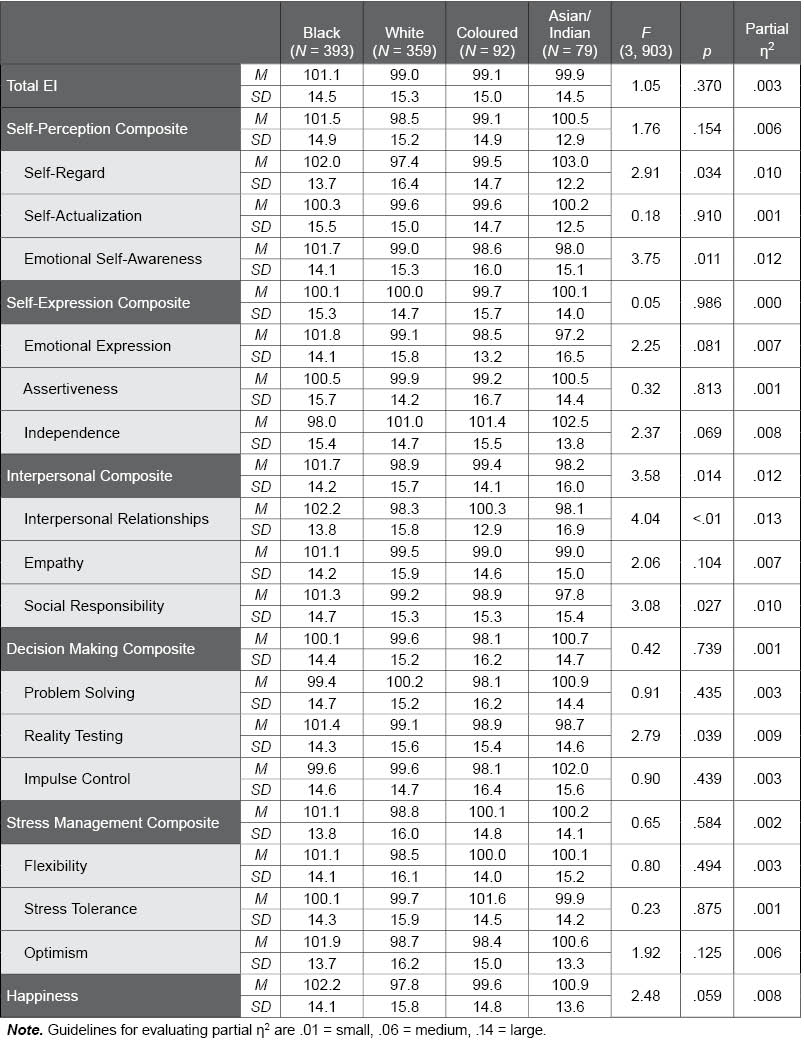
Table F.33. Ethnicity Group Differences in the South African EQ 360 2.0 Normative Sample
The following table provides EQ 360 2.0 standard score scale means and standard deviations for the various ethnicity groups in the South African normative sample. F and p values convey the statistical significance of ethnicity group differences; p values lower than .01 suggest significant differences among the ethnicity groups.