Appendix F: EQ 360 2.0 South African Norms
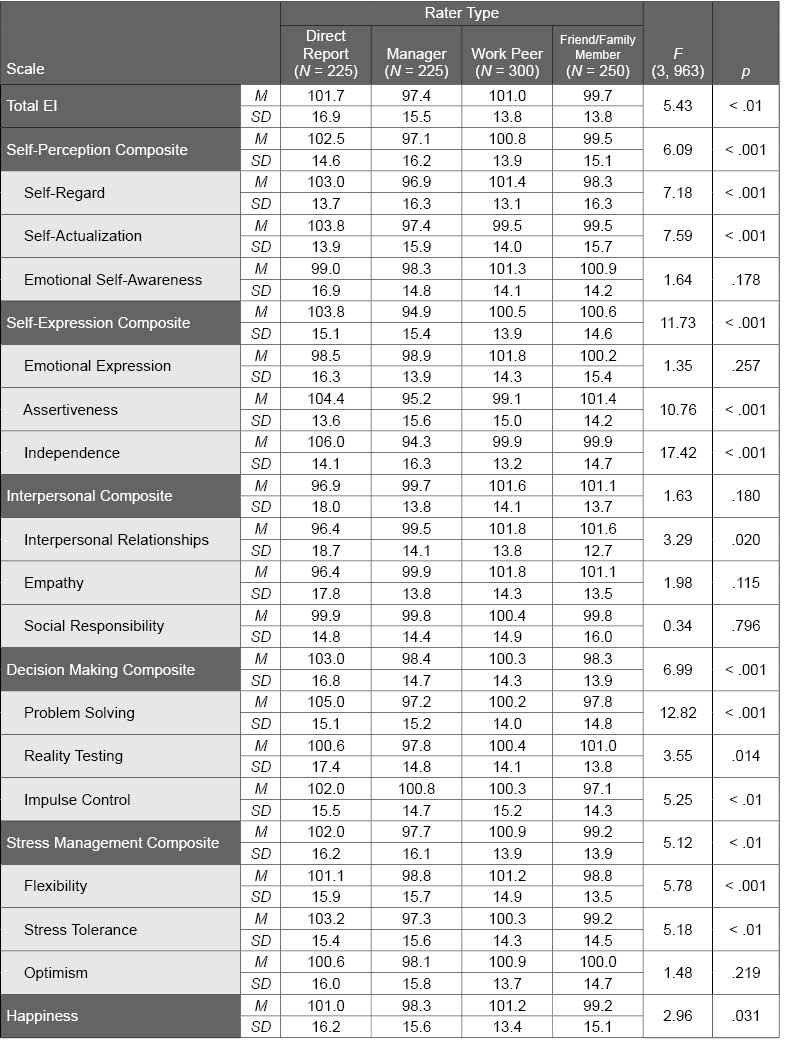
Table F.31. Rater Type Differences in the South African EQ 360 2.0 Normative Sample
The following table provides EQ 360 2.0 standard score scale means and standard deviations for the various rater types in the South African normative sample. F and p values convey the statistical significance of rater type group differences; There were consistent and mostly small effects with Direct Reports providing higher ratings, and Managers providing lower ratings than individuals from other rater types, although the results varied from scale to scale (see Table F.28).