Appendix F: EQ 360 2.0 South African Norms
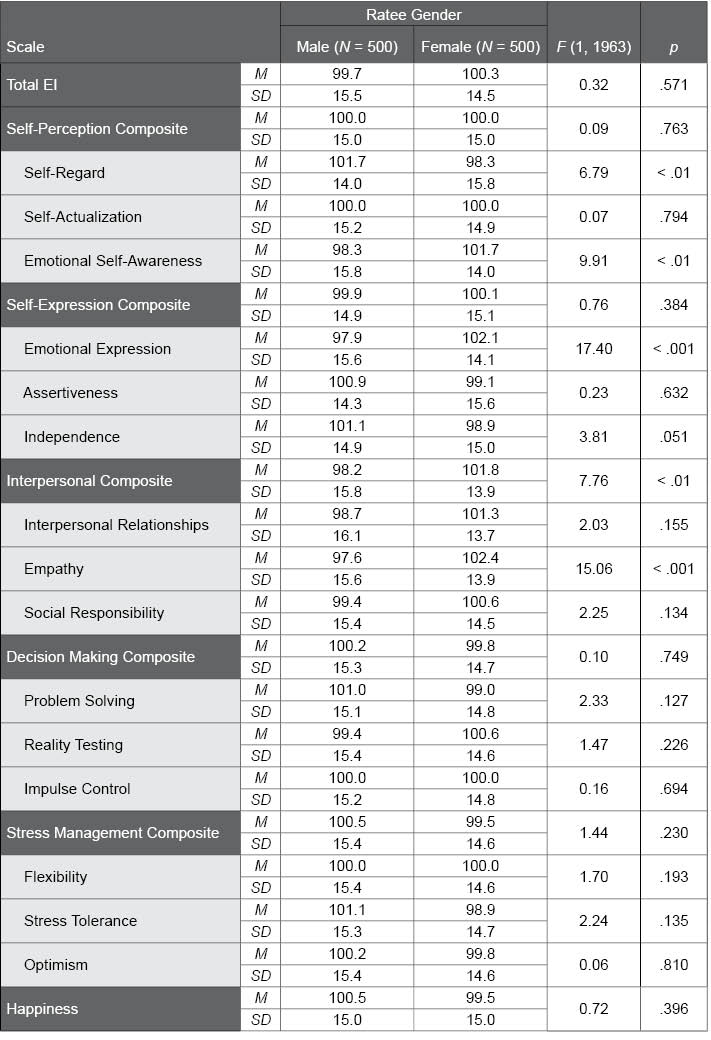
Table F.29. Gender Differences of Ratees in the South African EQ 360 2.0 Normative Sample
The following table provides EQ 360 2.0 standard score scale means and standard deviations for men and women in the South African normative sample. F and p values convey the statistical significance of gender differences; although some results were statistically significant (p values lower than .01), this was due to the large sample sizes, and the effect sizes were negligible for most scales (see Table F.28).