Appendix F: EQ-i® 2.0 South African Norms
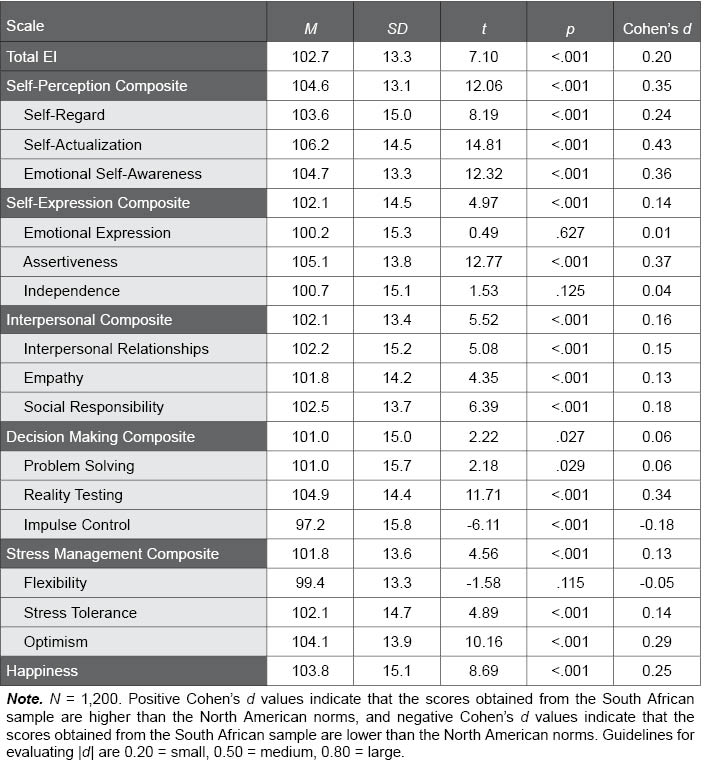
Table F.14. South African Normative Sample Scored with North American Professional Norms
The following table provides EQ-i 2.0 standard score scale means and standard deviations for the South African normative sample when scored with the North American Professional norms, and compared against a mean of 100. Cohen’s d values provide an effect size to describe differences between the samples as small, medium, or large; t and p values provide statistical significance tests for these differences.