Appendix D: EQ-i® 2.0 Australian Norms
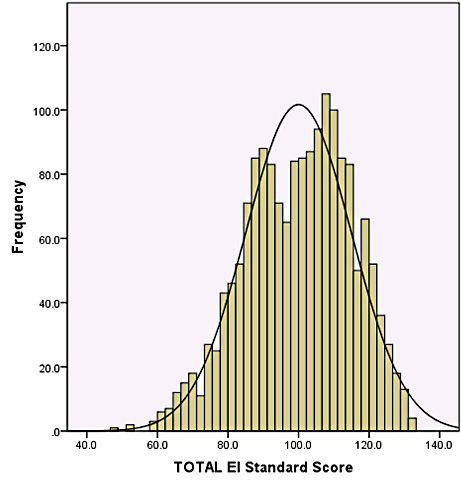
Figure D.2. Histogram of EQ 360 2.0 Total EI Standard Scores in the Australian Norm Sample
This figure illustrates the distribution of EQ 360 2.0 Total EI standard scores in the Australian normative sample. The distribution of the actual scores closely approximate the normal “bell-shaped” curve (shown using the black curved line), which suggests that it is unnecessary to apply a normalising transformation to the scores. Distributions for the other composite scales and subscales show a similar pattern.