Appendix D: EQ-i® 2.0 Australian Norms
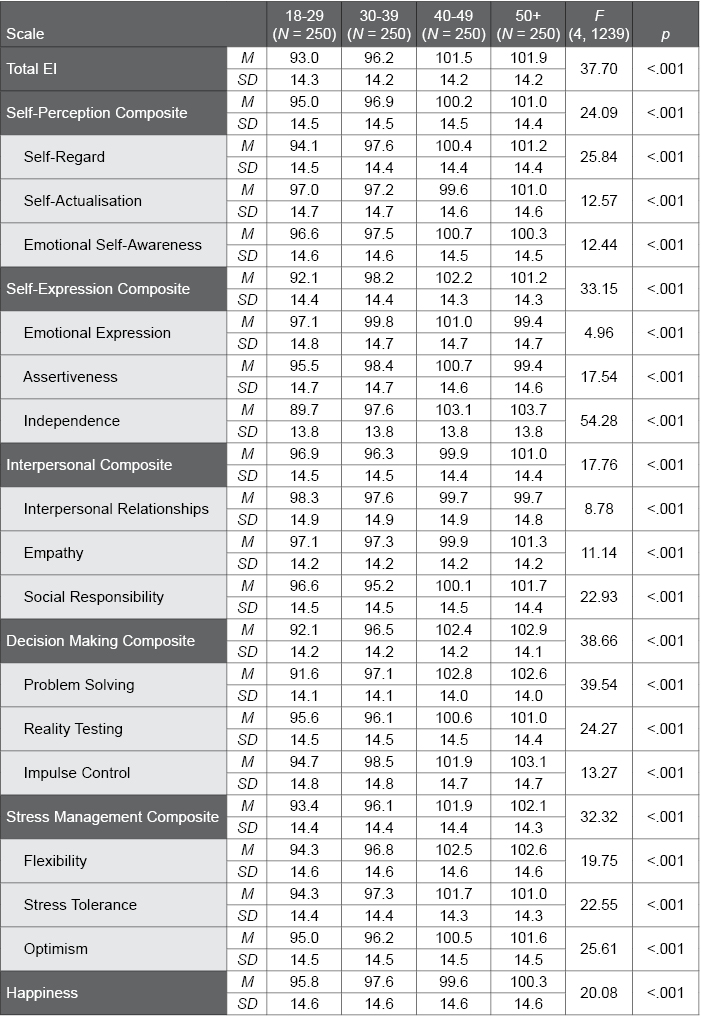
Table D.7. Age Differences in the EQ-i 2.0 Australian Norm Sample
The following table provides EQ-i 2.0 standard score scale means and standard deviations for the various age groups in the Australian normative sample. F and p values convey the statistical significance of age group differences; p values lower than .01, which were found for all scales, suggest significant differences among the age groups.