Appendix D: EQ-i® 2.0 Australian Norms
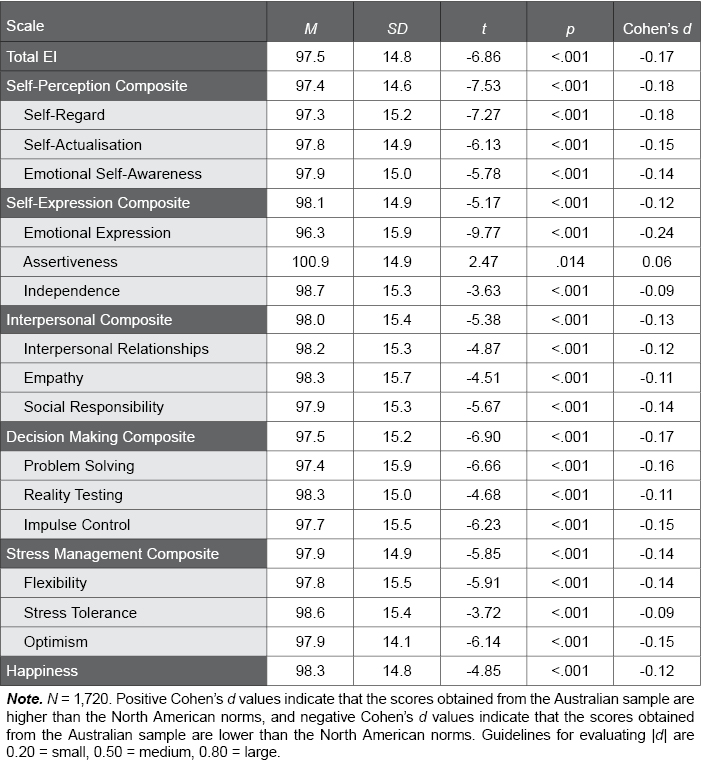
Table D.23. Australian EQ 360 2.0 General Population Norm Sample Scored with North American General Population Norms
The following table provides EQ 360 2.0 standard score scale means and standard deviations for the Australian normative sample when scored with the North American EQ 360 2.0 norms, and compared against a mean of 100. Cohen’s d values provide an effect size to describe differences between the samples as small, medium, or large; t and p values provide statistical significance tests for these differences. The results indicate negligible differences between EQ 360 2.0 scores obtained from the Australian general population norm sample and the North American 360 2.0 general population norms.