Part IV: Using the Results
EQ-i 2.0 Case Studies
Case Study 9
Submitted by: Deena Logan, Derek Mann, Katie Ziemer
Client Background
A large U.S. based pharmaceutical company was interested in identifying their sales representatives’ strengths and development opportunities. Despite having a well-developed and established competency model, this organization was particularly interested in the added insight made available by completing the EQ-i 2.0.
A sample of 137 sales representatives agreed to complete the EQ-i 2.0. Sales representatives were also evaluated by their respective manager or supervisor on each of seven competencies: Market and Therapeutic Knowledge, Selling the Portfolio, Building and Sustaining Valued Partnerships, Analysing, Prioritizing and Planning, Executing, Evaluating and Adjusting, EQ-Related Behaviors, and Overall Performance. Sales representatives were rated on their performance relative to the other sales representatives in their unit, on a 5-point scale from “weak” to “best.”
Summary of EQ-i 2.0 Results
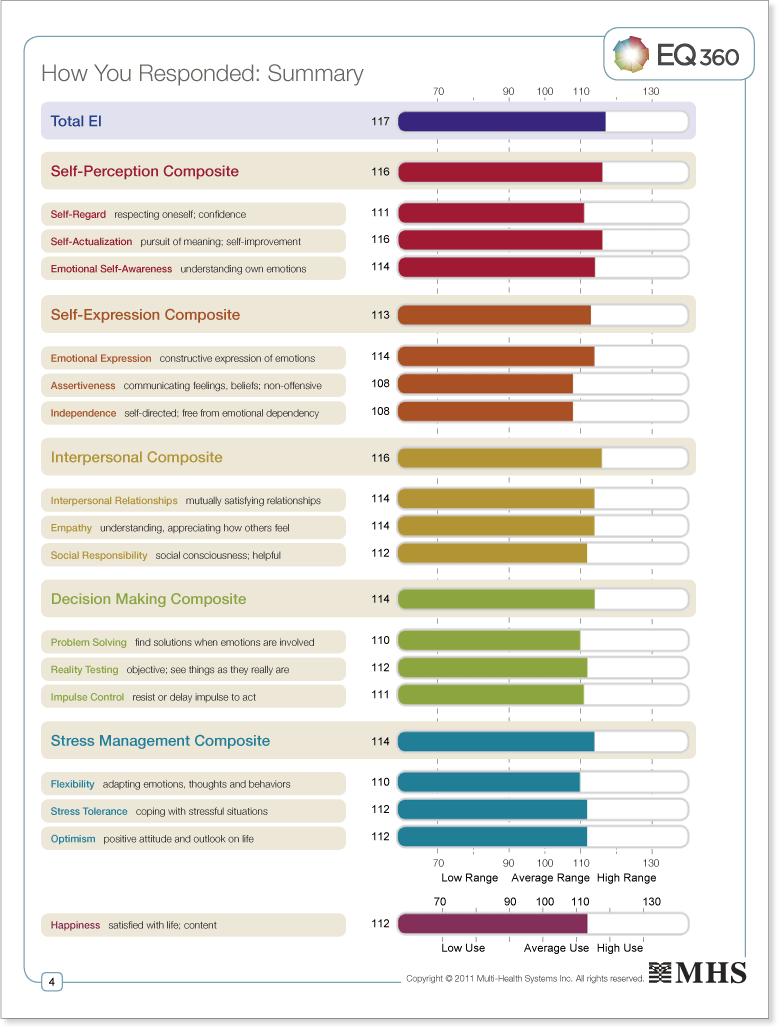
Collectively, the sales representatives have a Total EI score of 117, suggesting, on average, a high level of emotional and social functioning across team members. The same result holds true across the five composite and subscales with average scores ranging from 108 (Independence) to 116 (Self-Actualization). Considering that only 25% of the EQ-i 2.0 normative population score above 110, these scores suggest that this group is equipped with effective emotional and social functioning skills. Specifically, the Self-Perception (116) composite and the Interpersonal (116) composite results indicate an inner strength, confidence, and personal drive while maintaining the ability to develop and maintain relationships based on trust and compassion; two attributes that are integral to sales success.
However, when considering the collective results of individuals, there is a tendency for top and bottom performers to washout in the averaging process. As a result, to truly understand the impact that emotional intelligence has on the performance rating of these sales representatives, it is helpful to divide the sample into groups of performers based on performance ratings (in this case provided by managers and supervisors). For each of the competency areas outlined above, the sample was divided into thirds in order to compare the top and bottom performers on the EQ-i 2.0 scales. A number of significant differences in EQ-i 2.0 scores were observed between groups, demonstrating a relationship between emotional intelligence and performance. Group means and Cohen’s d measures of effect size are described below for each competency.
With regard to Market and Therapeutic Knowledge, the top performance group scored higher than the bottom performance group on Impulse Control (M = 114.75 vs. M = 108.73, d = .47), as well as on the Decision Making composite (M = 117.14 vs. M = 112.26, d = .43).
For Analyzing, Prioritizing, and Planning, the top performance group showed lower scores compared to the bottom performance group on a number of EQ-i scales, including Emotional Self-Awareness (M = 110.02 vs. M = 116.34, d = .48), Emotional Expression (M = 112.54 vs. M = 117.90, d = .49), Interpersonal Relationships (M = 111.61 vs. M = 115.56, d = .49), Empathy (M = 111.74 vs. M = 117.64, d = .56), and the Interpersonal composite (M = 113.23 vs. M = 118.74, d = .58).
For EQ-related behaviors, the top performance group scored higher than the bottom performance group on Impulse Control (M = 114.80 vs. M = 106.78, d = .56), the Decision Making composite (M = 116.92 vs. M = 111.49, d = .41), and the Stress Management composite (M = 116.20 vs. M = 111.63, d = .47).
Concerning overall performance, the top performance group scored higher than the bottom performance group on Impulse Control (M = 114.43 vs. M = 108.55, d = .45).
Most notable among these results is the relationship between Impulse Control and the areas of Demonstrating Market and Therapeutic Knowledge, EI-related behaviors, and Overall Performance. Salespeople are hungry for that next opportunity, but individuals with strong impulse control are better able to resist the urge to make quick promises or rush into providing a solution for a customer when their needs aren’t yet fully understood. Those with high impulse control tend to ask questions first rather than overreacting to negative emotions or relying on assumptions.
Also notable is the inverse relationship between Analyzing, Prioritizing, and Planning and a number of EQ-i 2.0 scales in the Self-Perception, Self-Expression, and Interpersonal areas. This pattern is not uncommon with sales-type roles. While these skills are of course necessary and can be advantageous for someone in a sales position, an overemphasis on such behaviors can have certain drawbacks. Becoming too heavily focused on emotions and relationship maintenance can cause one to lose sight of the task at hand, and other job requirements can suffer as a result. Being overly empathic can make it difficult to remain objective and prioritize tasks appropriately when strong emotions are involved, and cause one to avoid making tough decisions or dealing proactively with important client management issues. Furthermore, too much self-reflection can lead to feelings of insecurity in one’s abilities, and expressing such feelings too freely might make one appear incompetent, with the result that others may lose confidence in that person as a sales professional.
No significant differences in EQ-i 2.0 scores were observed on three of the scales, namely Selling the Portfolio, Building and Sustaining Valued Partnerships, and Executing, Evaluating, and Adjusting.
The fact that the top and bottom performers did not differ on the remaining EQ-i 2.0 scales is not to say that emotional intelligence is unimportant to success in these areas. Rather, this may be due to the limited variability in EQ-i 2.0 scores for this sample. As a whole, this group of sales representatives scored well above average across all emotional intelligence areas as measured by the EQ-i 2.0, and this is the case for both the top and bottom performance groups. For the results described above, the lower EQ-i 2.0 scores observed for the top or bottom performance group (depending on the scale in question) were not actually “low” scores, but were in the upper end of the mid range, or in the high range, compared to the general population.